back to guides

Top tech ecosystems

Introduction

Insights on 210 tech ecosystems

Our dataset for this startup ecosystem research starts with 168 unicorn cities, plus 33 cities with at least $100M in funding and min 50 VC rounds since 2017.

This brings the total dataset to 210 tech hubs. Each “hub” is a metro area.

For instance, Greater Boston includes Boston, Cambridge, Waltham, Burlington, Somerville, and many other towns. Tens of thousands of municipalities are included within these 201 hubs.

Three lenses

Not all tech ecosystems are created equal.

For instance, New York cannot be compared with Oxford. Therefore we created three lenses by which to benchmark ecosystems: “Scaleup Hubs”, “Science Hubs”, and “Rising Stars”.

Scaleup Hubs This lens looks for absolute scale across venture capital investment, university talent, patent development, and the number of unicorns and $1B+ exits minted. These locations usually have a well-established venture capital industry and capital markets. The success of these ecosystems paves the way and sets the bar for other cities, hence the term trailblazers.
Science Hubs This lens looks for high output per inhabitant, driven by their academic/research footprint and strong linkage between universities and startups. Looking at output per inhabitant helps surface smaller cities like Oxford, Leuven, and Eindhoven. Such hubs are crucial for developing novel, cutting-edge technology (i.e. Deep Tech). These hubs often specialize in specific domains, such as semiconductors or life sciences.
Rising Stars This lens looks at growth and growth potential. Startups in these hubs have benefited from the globalization of venture capital and distributed teams. The rise of a few local hero startups has often ignited the development of these hubs. Often these are emerging economies with a lower cost of living. There’s often the presence of local early-stage VCs, but they lack the depth of follow-on investors. Therefore they depend on their connectivity with bigger ecosystems to support startups’ growth at later stages.


The top 10

Scaleup Hubs

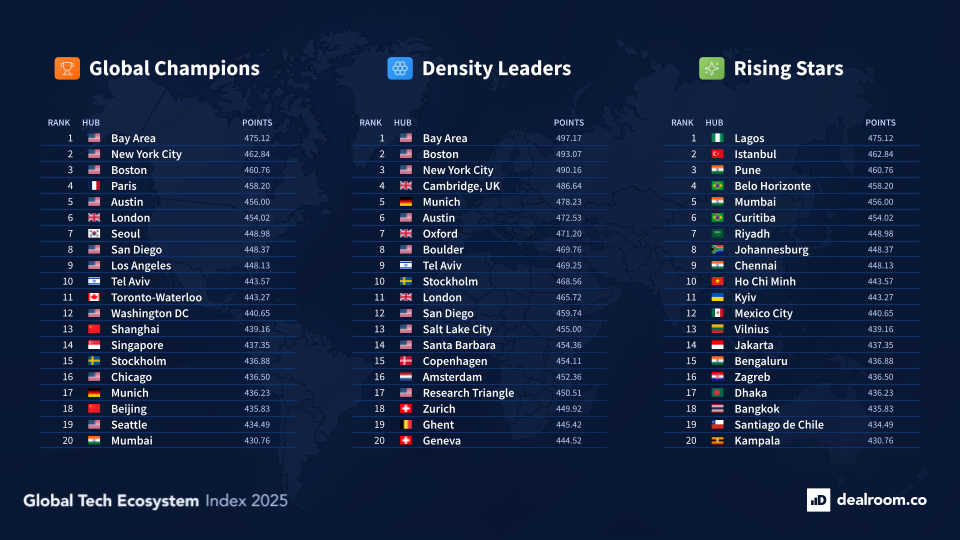
The Bay Area is the clear #1 tech ecosystem globally, leading by a wide margin.

The #2 is New Palo Alto, a cluster of European cities of close proximity, similar to the Bay Area.

Within a four-hour train ride connecting London, Paris, and Amsterdam lie some of the world’s best universities, diverse talent pools, and innovative tech companies.

New Palo Alto has globally the highest concentration of cities that have produced unicorns.

Below is a way to visualise a selection of Trailblazers, more clearly showing the relative strengths.

Tokyo is the frontrunner in Asia - its startup ecosystem is small relative to the size of the city, but it truly excels in patents – a reflection of its extensive corporate & industrial landscape.

This makes Tokyo a very relevant player in the next decade where startups and corporates converge and industrial strategy is becoming more important.

The positions of Beijing and Shanghai are lower than they might have been a few years ago. China-only patents are not counted, and the methodology puts emphasis on what happened since 2019, when China’s tech sector was starting to decline relative to the rest of the world.

The Bay Area leads by most metrics, but New Palo Alto and Boston lead by university talent. Within the next top 4, Paris also excels in university talent, while London excels in early-stage VC.

Science Hubs

The Bay Area still tops the list, despite being a large ecosystem. However, it is closely followed by Cambridge (UK) and Boston. Both score better on university talent.

Cities including Cambridge, Oxford, Eindhoven, Munich and Zurich are well positioned to lead in the next era of “Deep Tech” innovation as they excel in areas like life sciences, semiconductors, materials science, sensors, and optics.

Zooming in on the top 7 hubs shows again the Bay Area leading by all metrics except university linkage, even on a per capita basis, due to its sheer scale.

This time, however, smaller cities like Cambridge UK, and Eindhoven come to the surface.

The next 5 allow us to compare Zurich and Santa Barbara, two science hubs of similar size.

To get more similar comparisons, talk to our team.

Rising stars

When considering ecosystem growth, many less apparent names rise to the top, often in emerging economies with a lower cost of living.

These hubs benefit from the globalization of venture capital and distributed teams and the presence of local early-stage VCs.

Contrary to the Trailblazers and Science Hubs lenses, many less-obvious names emerge here. There are also significant differences in how each city ended up at the top of this benchmarking.

For instance, Bengaluru tops this category for excelling in its high ratio of unicorns relative to GDP per capita.

Curitiba Brazil performs well thanks to its high conversion from series A to unicorn.

Curitiba ranks well thanks to its high conversion from series A to unicorn, while Amsterdam’s late-stage VC has grown the most worldwide.

Others, like Oslo or Curitiba, tops the list in new unicorn growth and unicorn conversion score from Series A.

The results

Scaleup Hubs

Science Hubs

Rising Stars

Methodologies and Findings

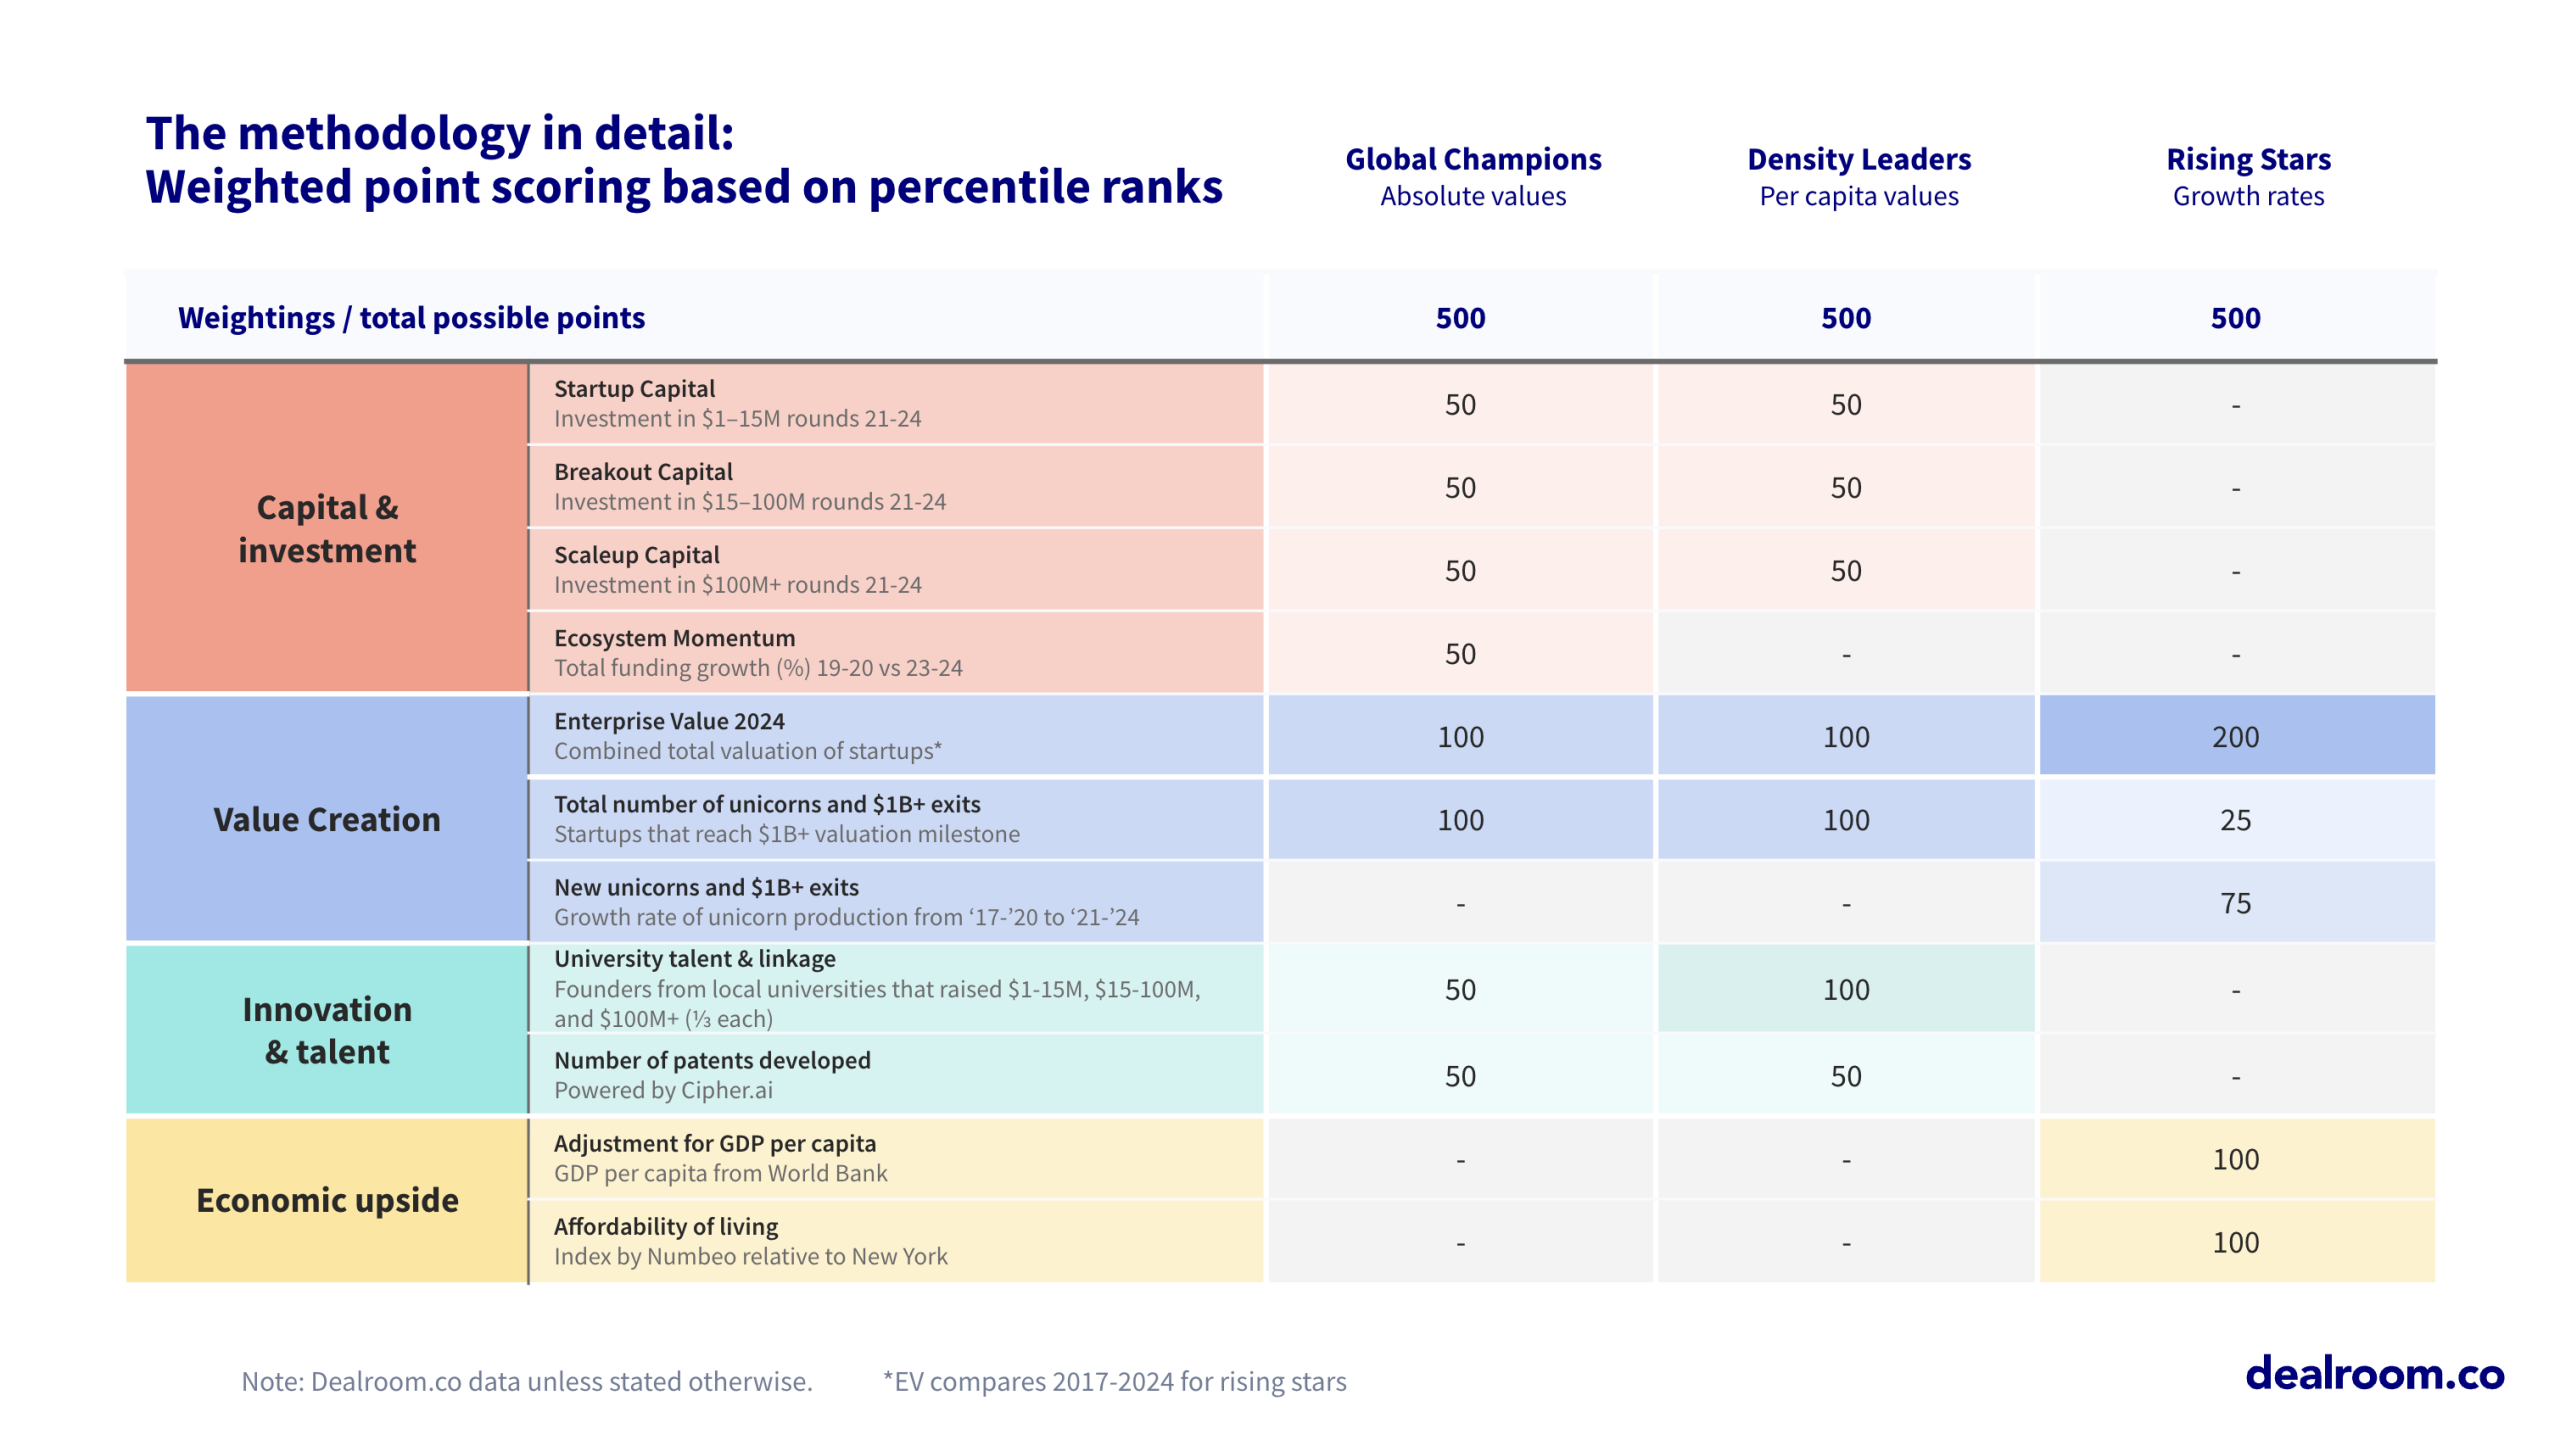
The below slide from the report describes the exact points system for each lens.

Age of Deep Tech

In the last decade, hundreds of tech ecosystems have sprung up globally.

There are now 168 cities with at least one unicorn (there were only 12 of them in 2010.)

Across the Americas, EMEA or Asia and Oceania, over 40 tech hubs have created over $100B in value.

The next 10 years

The fact that there are now 168 unicorn cities bodes well for the future – it means the entrepreneurial age and economic dynamism are spreading globally. But the next ten years are unlikely to be similar to the last.

New breakthroughs in New Frontier technologies are driving a new phase of radical innovation.

This means the coming decade will need next-generation tech ecosystems that are able to bring entrepreneurship, patient capital, deep R&D, and science under one roof.

So, rather than measuring a status quo on the top startup ecosystems worldwide, we created a set of three actionable benchmarks to help ecosystems understand and measure their maturity and preparedness for the future.

Learn more

Access the full 68 page report

Learn more

Global, USA, EMEA, Europe, Unicorns and Patents.