Live Data, Sharper Insights: Updates to the Global Tech Ecosystem Dashboard

In May 2025, we published the Global Tech Ecosystem Index, a benchmark covering 288 cities across 69 countries, alongside a live dashboard to explore the underlying data. The goal: to equip governments, investors and ecosystem builders with a transparent tool for benchmarking and data-driven decision-making.
Since then, we’ve continued to listen carefully to client feedback and refine our methodology. Today, we’re introducing Version 1.2, a further update emphasizing population accuracy, clearer metropolitan definitions, and overall data integrity.
Why We’re Updating
Tech ecosystems evolve fast, and so does the data. Many 2024 funding rounds are still being reported, and metrics like enterprise value or momentum continue to shift over time. To reflect this, the Index includes live data from v1.1 going forward, capturing new rounds from 2024 as they come in.
Following valuable feedback from clients, we identified inaccuracies regarding some metro definitions and population data. To uphold our commitment to transparency and reliability, we’ve thoroughly reviewed and revised our population figures and metropolitan definitions in v1.2.
These changes reflect our ongoing efforts to maintain a credible, accurate, and useful benchmark for global startup ecosystems.
Our Commitment to Users
We are directly communicating these changes to impacted cities and stakeholders, clearly explaining the reasons behind each adjustment. Thank you for supporting our continuous efforts to improve the accuracy, transparency, and usefulness of the Global Tech Ecosystem Index. A detailed changelog documenting all updates is available in this blog post and in our knowledge base for transparency.
What’s next
We’re continuing to build on the Index. Upcoming improvements include:
- Sector-specific rankings (e.g. AI, ClimateTech, Fintech) launching later this year
If you have questions, feedback, or ideas for improving our index, please get in touch.
Detailed Changelog
v1.2
Population Accuracy Improvements
- Munich: Corrected from including the broader Bavarian region to accurately reflect Munich Metro Area boundaries.
- Reviewed and revised population data for the Top 50 Density Leaders, ensuring consistency and correctness across the board.
Refined Metro Area Definitions
- Beijing: Adjusted from broader Jingjinji region to reflect only Beijing Metro Area proper.
- Shanghai: Revised from Yangtze Delta region to accurately define Shanghai Metro Area proper.
Removal of Redundant Cities
We removed several cities previously counted separately but considered part of larger metropolitan areas:
- Laval, Quebec (part of Greater Montreal)
- Kyushu and Okinawa
- Greater Kyoto (part of Osaka-Kobe-Kyoto agglomeration)
- Several U.S. metros: Provo-Orem, Santa Cruz-Watsonville, Ventura, Santa Rosa-Petaluma, and Long Island
Bug Fixes
- Updated autonomy numbers from using HQ+founded to HQ only to more accurately reflect domestic capital ratios
Notable Ranking Movements
These updates impacted rankings significantly in several cases:
Global Champions
- Shanghai: dropped from 10th to 18th place due to the new metro definition.
- Singapore: climbed two spots from 15th to 13th.
- Seattle: improved from 19th to 17th, benefiting from adjusted population metrics.
Density Leaders
- Munich: moving from 5th to 14th after correcting population data.
- New York City: moved down from the 3rd to 8th place.
- Boulder: rose notably from 8th to 5th.
- Stockholm: advanced four places, jumping from 10th to 6th.
v1.1
Live Data Feed
- The dashboard now updates automatically as new startup activity is reported. No fixed-date cutoffs!
Feature Improvements
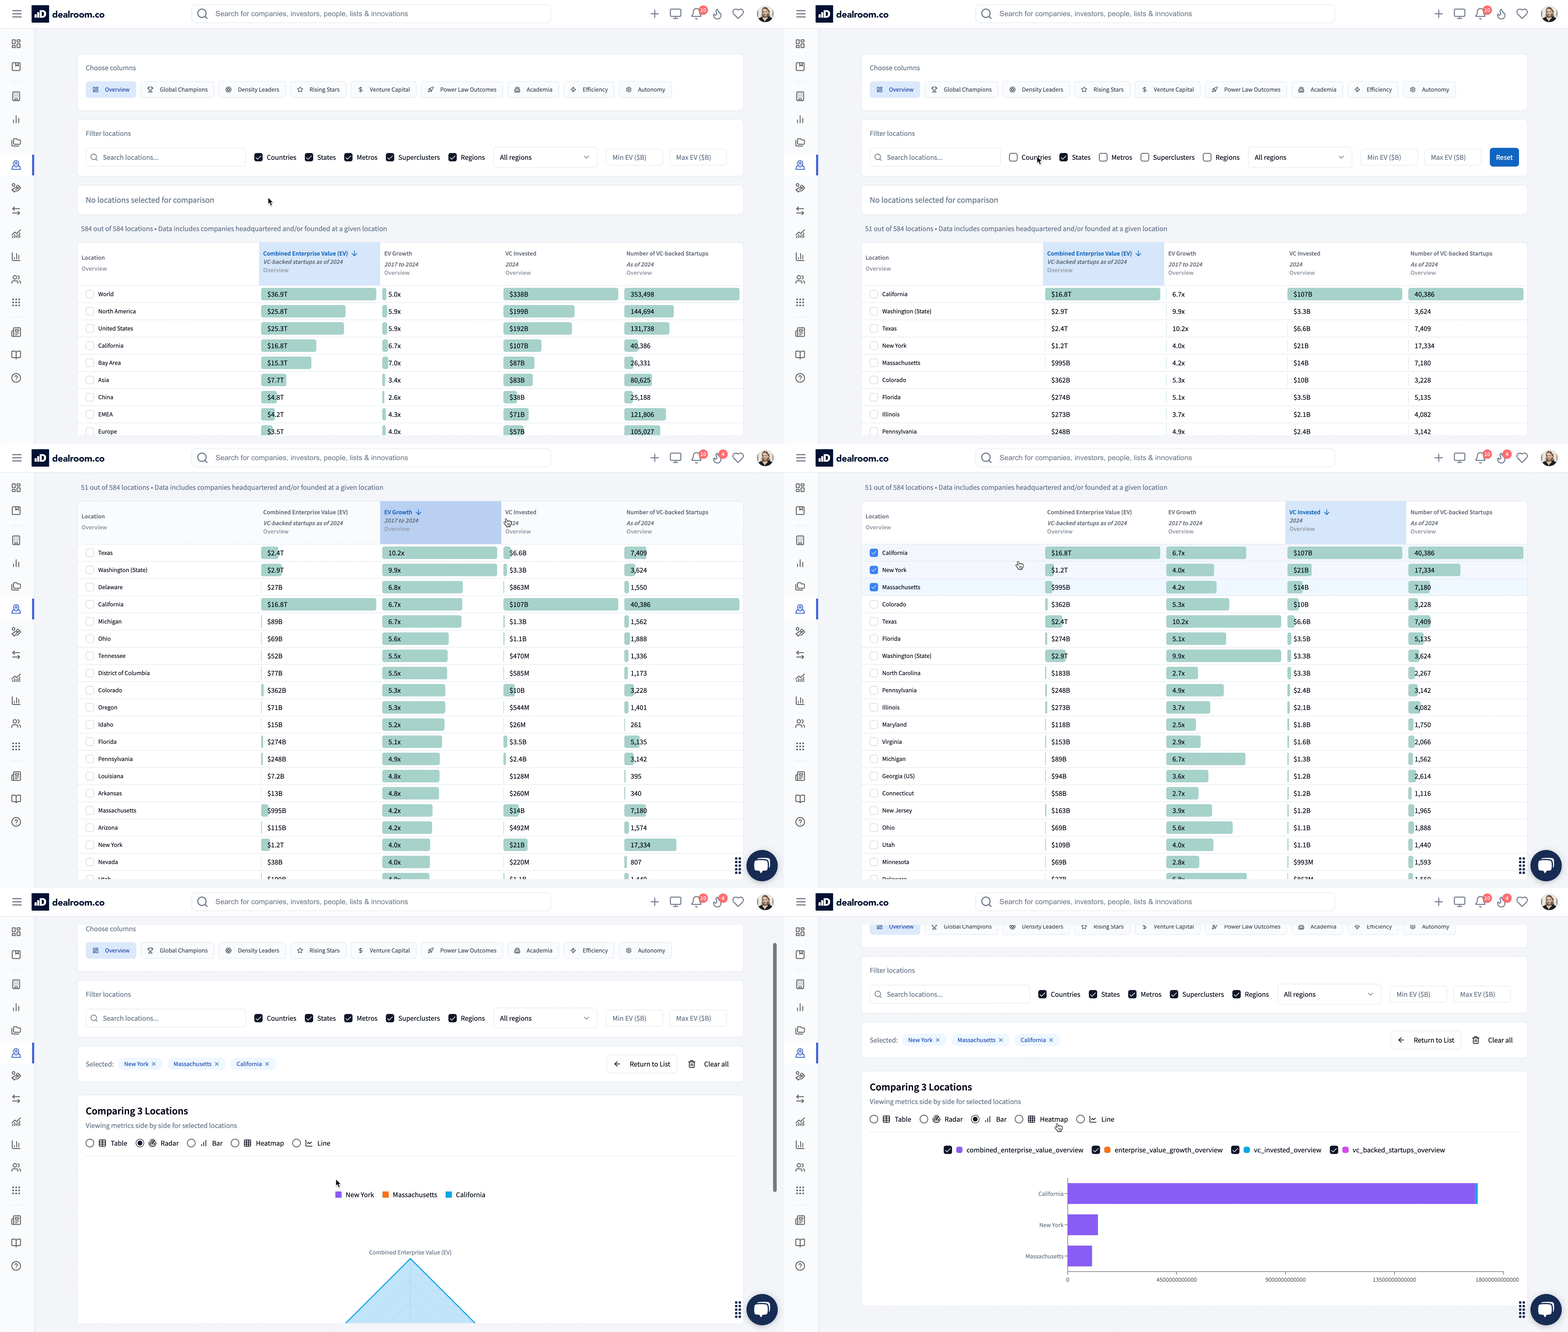
- Added data on US States, and a new filter for only displaying states
- EU region filter added.
- New region “New Palo Alto” added to highlight Europe’s leading cluster (London, Paris, Amsterdam, Cambridge, and others).
- Small naming changes to more accurately reflect the metro composition e.g. “Rotterdam” renamed to “Rotterdam – The Hague”.
Bug Fixes
- Enterprise Value correction in Global Champions category.
- Fixed an Enterprise Value bug that affected showed a 2-5% deviation in the Global Champions category.
- Conversion rate logic corrected in Efficiency metrics.
Ranking Movements
While most top cities maintained their positions, a few notable shifts occurred:
Global Champions
- Los Angeles moves ahead of San Diego to claim 8th place.
- Shanghai enters the top 10, up from #13, overtaking Tel Aviv.
- Amsterdam climbs into the top 20, swapping places with Mumbai.
Density Leaders
- Zurich gains one place, moving from #18 to #17, ahead of the Research Triangle.
Rising Stars
- Belo Horizonte (Brazil) enters the top 3.
- Kyiv climbs into the top 10 for the first time.
- Dakar breaks into the top 15, driven by large EV growth due to its unicorn Wave.
These changes are based on updated, percentile-based scoring across multiple metrics and we expect additional small movements as we receive new data going forward.
Bug Fixes
- Fixed an Enterprise Value bug that affected a 2-5% deviation in the Global Champions category
- Conversion rate logic corrected in Efficiency metrics
Ranking Movements
While most top cities maintained their positions, a few notable shifts occurred:
Global Champions
- Los Angeles moves ahead of San Diego to claim 8th place
- Shanghai enters the top 10, up from #13, overtaking Tel Aviv
- Amsterdam climbs into the top 20, swapping places with Mumbai
Density Leaders
- Zurich gains one place, moving from #18 to #17, ahead of the Research Triangle
Rising Stars
- Belo Horizonte (Brazil) enters the top 3
- Kyiv climbs into the top 10 for the first time
- Dakar breaks into the top 15, driven by large EV growth due to its unicorn Wave
These changes are based on updated, percentile-based scoring across multiple metrics and we expect additional small movements as we receive new data going forward.
Interested?
