Access the Global Tech Ecosystem Index directly at app.dealroom.co/tech-ecosystem-index
Overview
What is the Global Tech Ecosystem Index?
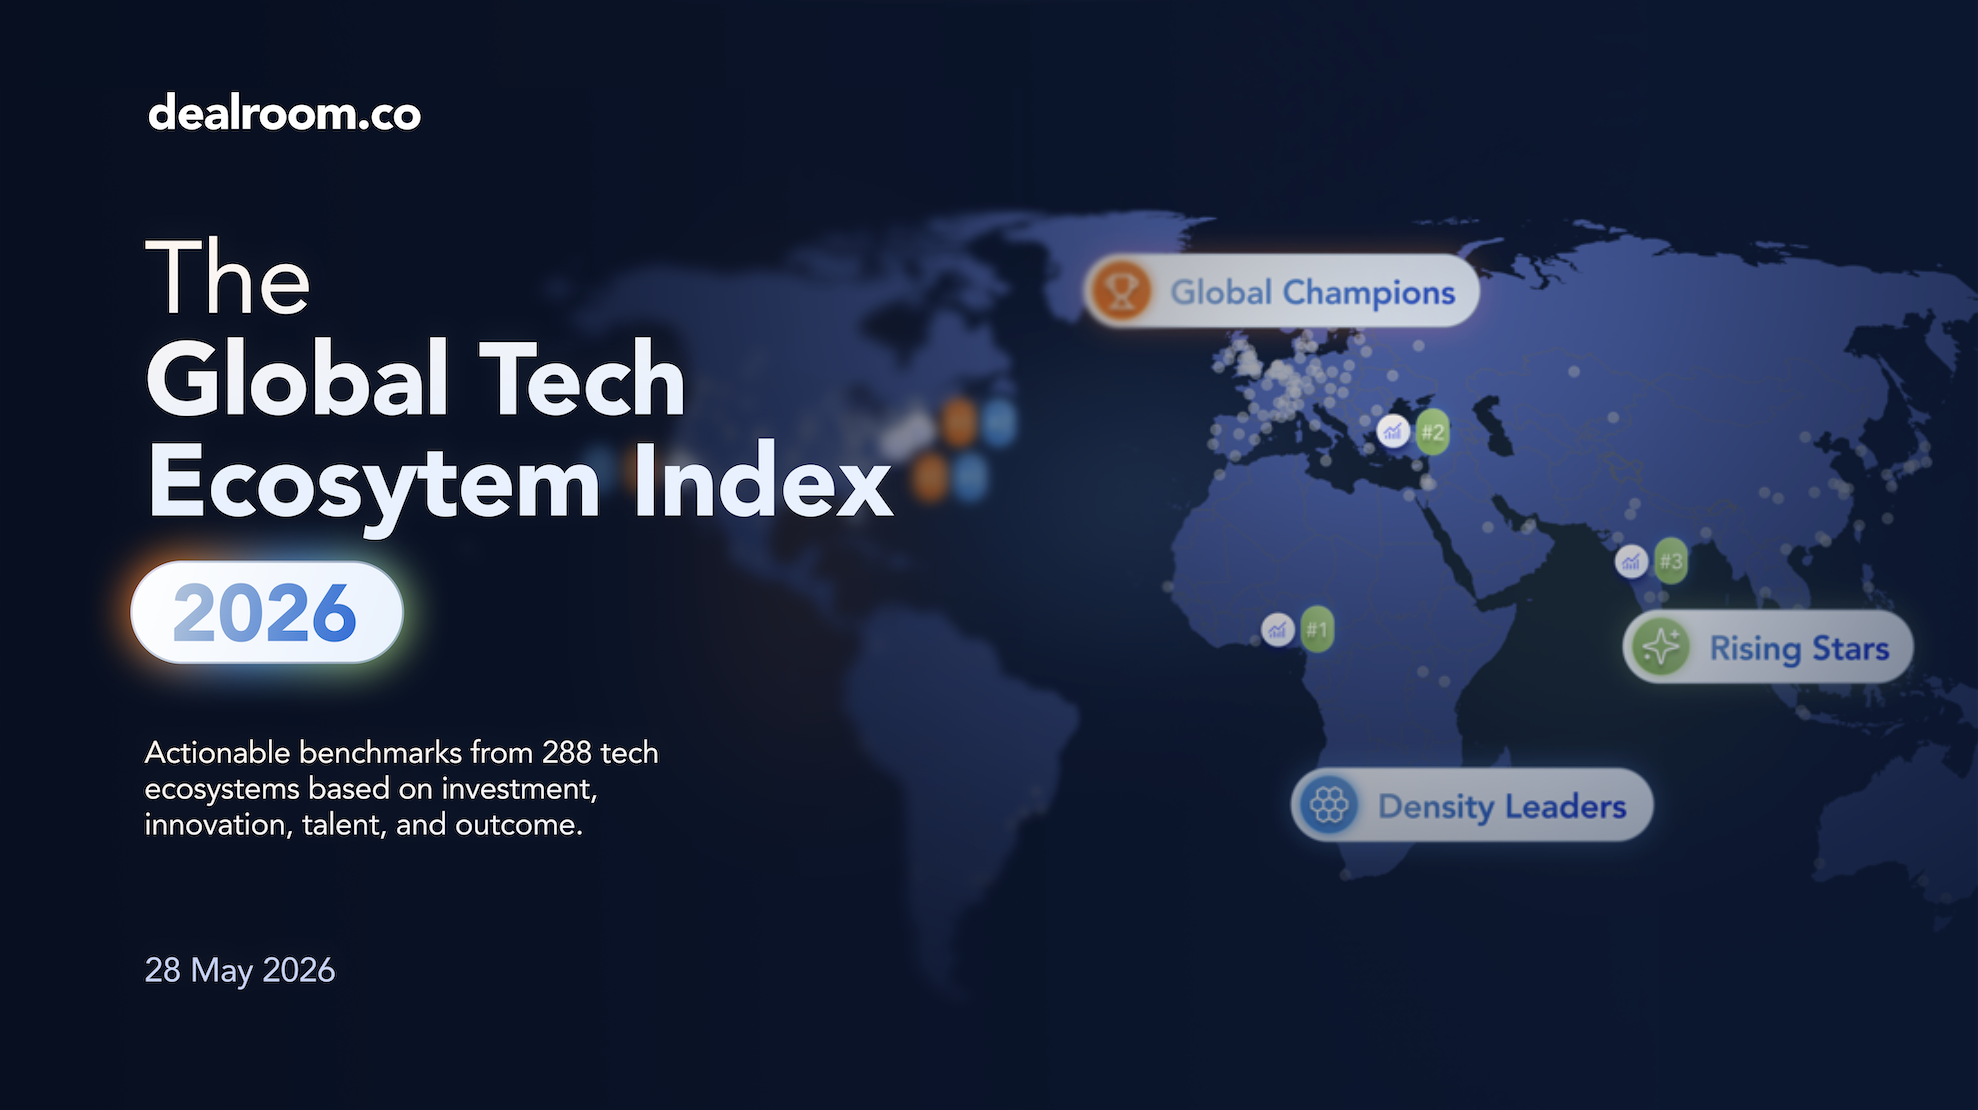
The Global Tech Ecosystem Index is Dealroom's annual benchmark covering 325 tech hubs worldwide. The 2026 edition brings fresh analysed data across investment, innovation, talent, and outcomes — giving policymakers, investors, and founders a clear, data-driven picture of where the world's tech activity is happening and how ecosystems compare to one another.
What's included in the Index?
The dashboard lists all 325 hubs and their rankings across the three dimensions below. For each hub you can access a detailed view with the underlying metrics that feed the index scores — including investment totals, startup counts, talent signals, and outcome data.
325 hubs ranked
Investment data
Innovation signals
Talent metrics
Outcomes
The Three Rankings
Global Champions
Ranks the biggest tech ecosystems in the world by absolute scale — looking at total investment, startup count, unicorn production, and overall ecosystem size. These are the hubs that dominate global tech in raw output.
Scale-based
Total investment
Unicorn output
Density Leaders
Highlights hubs that are punching above their weight through a per-capita lens. A hub with a smaller population but outsized startup or investment activity relative to its size can rank highly here — making it ideal for spotting hidden gems that raw size rankings miss.
Per-capita lens
Relative efficiency
Hidden gems
Rising Stars
Tracks the fastest-growing emerging hubs in the world — ecosystems that are accelerating at pace and building momentum year on year. Ideal for identifying the next wave of global tech centres before they reach champion status.
Growth trajectory
Emerging hubs
Momentum signals
Using the Dashboard
Exploring a hub's detail view
Click on any hub in the rankings list to open its detailed metrics view. You'll see the underlying data points driving its index score — broken down by investment, innovation, talent, and outcomes — giving you full transparency into why an ecosystem ranks where it does.
Comparing ecosystems side by side
Select any hub and use the compare feature to benchmark it against another city — for example, comparing London with Los Angeles. The data is displayed side by side across all key metrics, making it easy to understand the relative strengths and gaps between ecosystems.
Select a hub
Add a city to compare
Side-by-side metrics
Step-by-step video guide
Inside the Global Tech Ecosystem Index Dashboard — Explained
Step-by-step walkthrough of all three rankings and how to compare ecosystems
Read the full 2026 report
Unlock in-depth analysis, methodology notes, and key findings from the Global Tech Ecosystem Index 2026.
🔍
No results found
Try a different search term