
Product Reports Resources Pricing Login Book a demo

IoT Tribe

Accelerator programmes for deep tech, hardware and connected industry, run with corporates and public agencies since 2015
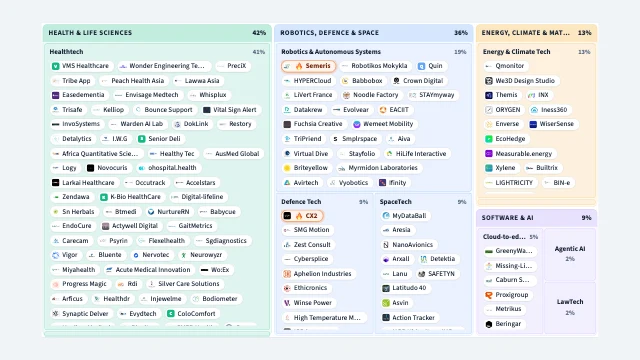
London, Singapore and Dublin · iottribe.org · 351 supported companies on Dealroom, in 44 countries · Market map: IoT Tribe — Supported Companies

1.1 Overview

351
Companies supported
44
Countries
16
Programmes
$2.1B
Raised in total
$3.3B
Combined enterprise value

IoT Tribe is a London accelerator for hardware and deep-tech startups, with an office in Singapore and, since April 2026, a European hub in Dublin at Trinity College Dublin, where it also runs ESB’s X_Potential innovation programme. It began in 2015 as Startup Scaleup, a European Commission accelerator with hubs in Dublin, Cartagena, Vilnius and Zoetermeer, and took its current name in 2017; Tanya Suarez founded it and runs it. Each programme is built with a corporate or public partner around one theme: Siemens’ Flywheel for agentic AI in aerospace and defence, delivered in the United States; CHISEL Healthcare InnoMatch with Singapore’s hospital clusters; NATO DIANA’s UK accelerator through the Janus consortium; and three Space Endeavour cohorts. On its own count it has run more than 30 programmes for over 500 startups from more than 30 countries, whose alumni have raised over $270M.

This page follows the 351 companies IoT Tribe lists as supported on Dealroom. Together they have raised $2.1B, $875.3M of it by Multiverse Computing, the one unicorn among them.

1.2 Programmes

16 programmes, 29 cohorts

Companies on the map by the programme that supported them. CHISEL Healthcare InnoMatch is the largest by far: its 2024 cohort alone holds 100 companies. 26 of the 351 companies are on the vertical landscape only, with no cohort listed.

CHISEL Healthcare InnoMatch2 cohorts
108
Run with Singapore’s Centre for Healthcare Innovation; winners test their product in the country’s hospital clusters with up to S$500,000 of funding.
Startup Scaleup2 cohorts
40
The European Commission accelerator IoT Tribe grew out of, run from 2015 across four hubs in Cartagena, Dublin, Vilnius and Zoetermeer: 132 startups through eight cohorts in two years.
Space Endeavour3 cohorts
29
Three cohorts of space-technology startups, each a twelve-week programme.
London Tech Calling5 cohorts
25
Deeptech Accelerator3 cohorts
23
UK Defence Innovation 20252 cohorts
15
NATO DIANA2 cohorts
12
NATO’s dual-use accelerator. IoT Tribe delivers its business acceleration in London for the UK Defence and Security Accelerator.
UK My Digital Innovationone cohort
12
Decarbonise SYone cohort
11
Connected Placesone cohort
8
Industrial Tech2 cohorts
8
UK-ASEAN SHOWCASE 2022one cohort
8
Retail Techone cohort
7
Siemens’ Flywheelone cohort
7
Launched with Siemens Digital Industries Software in January 2025 for agentic-AI startups in aerospace and defence, and delivered in the United States.
Singapore Great Legal Services Programmeone cohort
7
KTO Demo Dayone cohort
5
Dealroom

1.3 Market map

All 351 companies on one map

2.1 Headquarters

Headquartered mostly in Singapore and the United Kingdom

339 of the 351 companies have a headquarters on record, in 44 countries. Singapore and the United Kingdom hold 73 each; Spain is third with 23, and 193 are spread across the other 42. Bubbles are sized by the number of companies; hover one for the names.

Dealroom

2.2 Company profile

The median company was founded in 2018 and has 10 people

351 companies with a Dealroom profile. 253 have raised money on record, 174 of them with the amount disclosed. 13 have been acquired and 9 have closed.

Founded

Before 201567
2015–201794
2018–2020105
2021–202352
2024 on4
Not on record29

Team size

1–10 people161
11–50118
51–20025
Over 2007
Not on record40

Funding raised

No amount on record177
Under $1M58
$1–5M62
$5–20M40
$20M and over14

Status

Operating324
Acquired13
Low activity5
Closed9
Dealroom

2.3 Value over time

Combined enterprise value: $164.2M at the end of 2016, $3.3B now, 20× in ten years

Combined enterprise value of the VC-backed companies on the map at the end of each year, split by headquarters country or by segment, and the money they raised per year by round size. The two tallest funding bars are Multiverse Computing’s $208M Series B in 2025 and $550M Series C in 2026; 2026 is a partial year.

Combined enterprise value at the end of each year

The VC-backed companies on the map at their latest priced valuation, summed per year.

Split by
$0$1B$2B$3B$4B2015 · United Kingdom: $9M2015 · United States: $33.5M2015 · Singapore: $14.2M2015 · South Korea: $6.8M2015 · Other: $1.6M20152016 · United Kingdom: $16.9M2016 · United States: $56M2016 · Singapore: $14.2M2016 · South Korea: $25.2M2016 · Other: $51.9M2017 · Spain: $5.3M2017 · United Kingdom: $29.9M2017 · United States: $66.9M2017 · Singapore: $44.4M2017 · South Korea: $22.8M2017 · Other: $63.1M20172018 · Spain: $22.5M2018 · United Kingdom: $69.3M2018 · United States: $81.3M2018 · Singapore: $39.3M2018 · South Korea: $24.5M2018 · Other: $147.6M2019 · Spain: $22.5M2019 · United Kingdom: $209.2M2019 · United States: $143.3M2019 · Singapore: $60M2019 · South Korea: $29M2019 · Other: $239.7M20192020 · Spain: $32.7M2020 · United Kingdom: $262.5M2020 · United States: $163.3M2020 · Singapore: $120.2M2020 · South Korea: $35.5M2020 · Israel: $32M2020 · Other: $290.3M2021 · Spain: $116M2021 · United Kingdom: $288.3M2021 · United States: $163.3M2021 · Singapore: $168.4M2021 · South Korea: $57.3M2021 · Israel: $32M2021 · Other: $360.3M20212022 · Spain: $132.4M2022 · United Kingdom: $300.3M2022 · United States: $244.3M2022 · Singapore: $278.7M2022 · South Korea: $84.7M2022 · Israel: $32M2022 · Other: $578.6M2023 · Spain: $132.4M2023 · United Kingdom: $376.7M2023 · United States: $245M2023 · Singapore: $322M2023 · South Korea: $169M2023 · Israel: $32M2023 · Other: $591.8M20232024 · Spain: $227.3M2024 · United Kingdom: $401.8M2024 · United States: $342.6M2024 · Singapore: $324.7M2024 · South Korea: $239.4M2024 · Israel: $32M2024 · Other: $610M2025 · Spain: $617.8M2025 · United Kingdom: $510.5M2025 · United States: $530.9M2025 · Singapore: $338.1M2025 · South Korea: $268.9M2025 · Israel: $232M2025 · Other: $642.7M2026 to date · Spain: $639.6M2026 to date · United Kingdom: $584M2026 to date · United States: $530.9M2026 to date · Singapore: $348.5M2026 to date · South Korea: $273.7M2026 to date · Israel: $232M2026 to date · Other: $660.1M$3.3B2026*Spain$639.6MUnited Kingdom$584MUnited States$530.9MSingapore$348.5MSouth Korea$273.7MIsrael$232MOther$660.1M
$0$1B$2B$3B$4B2015 · Robotics, Defence & Space: $15.8M2015 · Software & AI: $12.8M2015 · Health & Life Sciences: $12.7M2015 · Energy, Climate & Materials: $23.8M20152016 · Robotics, Defence & Space: $56.5M2016 · Software & AI: $36.4M2016 · Health & Life Sciences: $42.3M2016 · Energy, Climate & Materials: $29M2017 · Robotics, Defence & Space: $98.5M2017 · Software & AI: $48.4M2017 · Health & Life Sciences: $49.2M2017 · Energy, Climate & Materials: $36.4M20172018 · Robotics, Defence & Space: $157.9M2018 · Software & AI: $51.6M2018 · Health & Life Sciences: $86.2M2018 · Energy, Climate & Materials: $88.7M2019 · Robotics, Defence & Space: $272.4M2019 · Software & AI: $116M2019 · Health & Life Sciences: $95.9M2019 · Energy, Climate & Materials: $219.4M20192020 · Robotics, Defence & Space: $348.3M2020 · Software & AI: $152.8M2020 · Health & Life Sciences: $173.9M2020 · Energy, Climate & Materials: $261.5M2021 · Robotics, Defence & Space: $427.4M2021 · Software & AI: $197.2M2021 · Health & Life Sciences: $256.7M2021 · Energy, Climate & Materials: $304.3M20212022 · Robotics, Defence & Space: $572M2022 · Software & AI: $285.7M2022 · Health & Life Sciences: $419.2M2022 · Energy, Climate & Materials: $374.1M2023 · Robotics, Defence & Space: $616M2023 · Software & AI: $317.4M2023 · Health & Life Sciences: $536.2M2023 · Energy, Climate & Materials: $399.2M20232024 · Robotics, Defence & Space: $801.8M2024 · Software & AI: $398.3M2024 · Health & Life Sciences: $568.3M2024 · Energy, Climate & Materials: $409.5M2025 · Robotics, Defence & Space: $1.1B2025 · Software & AI: $837.3M2025 · Health & Life Sciences: $793.2M2025 · Energy, Climate & Materials: $409.5M2026 to date · Robotics, Defence & Space: $1.1B2026 to date · Software & AI: $910.7M2026 to date · Health & Life Sciences: $813.3M2026 to date · Energy, Climate & Materials: $409.5M$3.3B2026*Robotics, Defence & Space$1.1BSoftware & AI$910.7MHealth & Life Sciences$813.3MEnergy, Climate & Materials$409.5M

* 2026 to date. Source: Dealroom.co

Dealroom

Money raised per year, by round size

Every round on record for the companies on the map, in the year it closed.

$0$200M$400M$600M$800M2015 · Rounds under $15M: $9.2M20152016 · Rounds under $15M: $28.2M2017 · Rounds under $15M: $37.4M20172018 · Rounds under $15M: $47.6M2018 · $15–100M: $16.4M2019 · Rounds under $15M: $62.6M2019 · $15–100M: $60M20192020 · Rounds under $15M: $108.1M2021 · Rounds under $15M: $95.5M20212022 · Rounds under $15M: $137.2M2022 · $15–100M: $81M2023 · Rounds under $15M: $47M2023 · $15–100M: $47.9M20232024 · Rounds under $15M: $46.1M2024 · $15–100M: $59.3M2025 · Rounds under $15M: $81.5M2025 · $15–100M: $207.6M2025 · $100M and over: $207.9M2026 to date · Rounds under $15M: $43.1M2026 to date · $15–100M: $18.5M2026 to date · $100M and over: $550M$611.6M2026*Rounds under $15M$43.1M$15–100M$18.5M$100M and over$550M

* 2026 to date. Source: Dealroom.co

Dealroom

2.4 Founders

The founders behind the highest-Signal companies

Dealroom has 377 founders on record for 222 of the companies. These are the founders of the twelve companies with the highest Dealroom Signal that have a founder photo on file.

3.1 The segments

The markets IoT Tribe’s companies build in

The Dealroom segment behind each vertical, on the same tags as the charts below: VC-backed companies founded since 1990, those valued at $1B or more, the VC invested in 2025, and how many times 2016’s that is. A company with several tags counts in each segment.

SegmentIoT Tribe companiesVC-backed companiesUnicornsVC invested, 20252025 vs 2016
RoboticsRobotics & Autonomous Systems 65 6,904 165 $35.1B 10×
DefenceDefence Tech 31 750 37 $11.3B 31×
SpaceSpaceTech 31 1,028 52 $8.7B 5.0×
Health techHealthtech 144 35.5K 739 $69.7B 2.4×
EnergyEnergy & Climate Tech 44 14.5K 231 $32.6B 3.2×
Climate techEnergy & Climate Tech 44 12.8K 287 $39.4B 3.5×
Internet of ThingsCloud-to-edge Tech 18 5,956 110 $7.3B 1.2×
AIAgentic AI 7 30.8K 815 $220B 13×

Source: Dealroom.co · 10 September 2026

Dealroom

3.2 VC investment by segment

Where venture money went, segment by segment

VC investment per year into companies tagged to each segment, 2016 to 2026, each chart on its own scale. Counts verified VC rounds into VC-backed companies; a company with several tags counts in each segment, but only once within a segment. 2026 is a partial year, not comparable with a full year. Robotics includes autonomous vehicles, defence systems and physical AI, not only robot manufacturers.

RoboticsRobotics & Autonomous Systems
2016: $3.4B in 841 rounds’162017: $6.3B in 960 rounds2018: $11.2B in 1,209 rounds2019: $10.7B in 1,245 rounds2020: $14.5B in 1,228 rounds’202021: $24.2B in 1,387 rounds2022: $18.3B in 1,513 rounds2023: $12.4B in 1,342 rounds2024: $25.1B in 1,323 rounds2025: $35.1B in 1,617 rounds’252026 to date: $82.8B in 1,166 rounds26*$35.1B$82.8B
DefenceDefence Tech
2016: $360M in 79 rounds’162017: $427.4M in 69 rounds2018: $529.8M in 62 rounds2019: $508.1M in 81 rounds2020: $964.8M in 74 rounds’202021: $2.7B in 116 rounds2022: $3.2B in 107 rounds2023: $2.4B in 129 rounds2024: $3.8B in 151 rounds2025: $11.3B in 327 rounds’252026 to date: $21.1B in 276 rounds26*$11.3B$21.1B
SpaceSpaceTech
2016: $1.7B in 115 rounds’162017: $1.5B in 152 rounds2018: $2.1B in 185 rounds2019: $3.9B in 227 rounds2020: $5.3B in 211 rounds’202021: $8.4B in 352 rounds2022: $5.6B in 329 rounds2023: $5.7B in 310 rounds2024: $5.5B in 293 rounds2025: $8.7B in 362 rounds’252026 to date: $28.4B in 248 rounds26*$8.7B$28.4B
Health techHealthtech
2016: $29.1B in 4,879 rounds’162017: $40.4B in 5,394 rounds2018: $56.9B in 6,103 rounds2019: $57.9B in 6,199 rounds2020: $83B in 6,513 rounds’202021: $135B in 7,478 rounds2022: $91.2B in 6,907 rounds2023: $63.9B in 5,433 rounds2024: $68.8B in 4,637 rounds2025: $69.7B in 4,665 rounds’252026 to date: $55.2B in 2,527 rounds26*$135B$69.7B$55.2B
EnergyEnergy & Climate Tech
2016: $10.1B in 1,503 rounds’162017: $10.4B in 1,674 rounds2018: $15.3B in 1,911 rounds2019: $16.5B in 2,012 rounds2020: $18.8B in 2,024 rounds’202021: $43.9B in 2,627 rounds2022: $50B in 2,949 rounds2023: $39.8B in 2,918 rounds2024: $29.9B in 2,305 rounds2025: $32.6B in 2,462 rounds’252026 to date: $36.2B in 1,278 rounds26*$50B$32.6B$36.2B
Climate techEnergy & Climate Tech
2016: $11.3B in 1,418 rounds’162017: $17.9B in 1,746 rounds2018: $31.7B in 2,170 rounds2019: $30.8B in 2,527 rounds2020: $31.4B in 2,801 rounds’202021: $76.1B in 3,770 rounds2022: $77B in 4,040 rounds2023: $51.6B in 3,493 rounds2024: $40.7B in 2,764 rounds2025: $39.4B in 2,510 rounds’252026 to date: $40.4B in 1,113 rounds26*$77B$39.4B$40.4B
Internet of ThingsCloud-to-edge Tech
2016: $6B in 1,457 rounds’162017: $10.3B in 1,554 rounds2018: $12B in 1,604 rounds2019: $12.3B in 1,513 rounds2020: $13.1B in 1,244 rounds’202021: $24B in 1,300 rounds2022: $13.7B in 1,105 rounds2023: $7.6B in 828 rounds2024: $6.9B in 608 rounds2025: $7.3B in 612 rounds’252026 to date: $6.7B in 295 rounds26*$24B$7.3B$6.7B
AIAgentic AI
2016: $16.5B in 4,026 rounds’162017: $31B in 4,831 rounds2018: $53.6B in 5,705 rounds2019: $50B in 5,824 rounds2020: $57.7B in 5,441 rounds’202021: $122B in 6,842 rounds2022: $80B in 6,481 rounds2023: $75.2B in 7,026 rounds2024: $124B in 6,387 rounds2025: $220B in 6,474 rounds’252026 to date: $504B in 4,477 rounds26*$220B$504B

* 2026 to 2026-09-10. Snapshot: 2026-09-10. Source: Dealroom Next Gen API. Robotics includes Waymo and Prometheus; their large rounds are included under the same tag definition used in the table.

Dealroom

Follow these companies as they raise

Every company on this page has a live Dealroom profile: funding rounds, team, Signal and news, updated as it happens.