 I
InMobi
Enabling consumers to discover amazing products through mobile advertising
 L Catterton backs AI shopper Glance as agentic commerce race heats up
 True North buys $50M stake in IPO-bound InMobi
Open roles
InMobi in the Kadubeesanahalli ecosystem
The InMobi office with the hot startups, most funded companies and investors around it. Hover or tap a pin.
Dealroom maps whole ecosystems like this one for cities, regions and governments. See the ecosystem platform →
Investors
From Dealroom's funding and investor records, grouped by the round each investor first entered.
Seed1 investor entered at this stage
- MAMumbai Angels
Series A2 investors entered at this stage
 Kleiner Perkins
- SVSherpalo Ventures
Series B and later8 investors entered at this stage
- LVLightbox Ventures
- MSMohit Saxena
- PSPiyush Shah
 SoftBank
- VPVatera Healthcare Partners
 SoftBank Vision Fund
- ASAbhay Singhal
- NTNaveen Tewari
Ownership
Estimated cap table from Dealroom's shareholder data — share of equity by holder. Stakes as last recorded by Dealroom (2026). Percentages are indicative.
Some investors are hidden on this public profile. See the full cap table on Dealroom →
Source: Dealroom Talent Intelligence.
Alumni founders
Former InMobi employees who went on to found companies, sorted by Dealroom signal score.
 MEMeeshoEst. 2015
 Vidit AatreyIndia
 SNSnapmintEst. 2015
 Rahul AgarwalIndia
 TSTripledot StudiosEst. 2017
 Akin BabayigitUnited Kingdom
 YUYuluEst. 2017
 Amit GuptaIndia
Patents
13 active patent families included in this estimate.
A patent family groups patent filings for the same invention. Source: Dealroom · PatSnap.
Investments and acquisitions
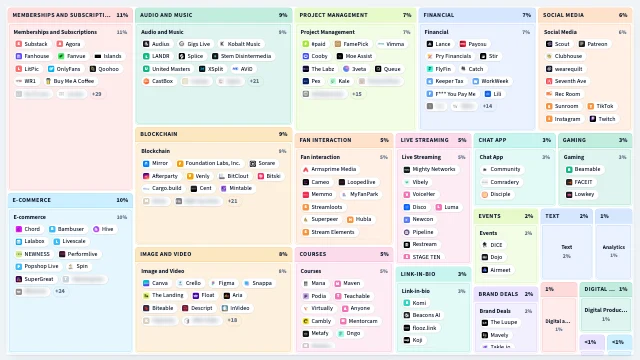
Disclosed deals where InMobi was the backer or acquirer, 2011–2023. Toggle between venture rounds, M&A, or both. The map below is grouped by the target company's sector — the colored pill on each chip is the round type.
8 deals across InMobi's capital deployment.
Where the deals concentrate by sector, stage, and decade.
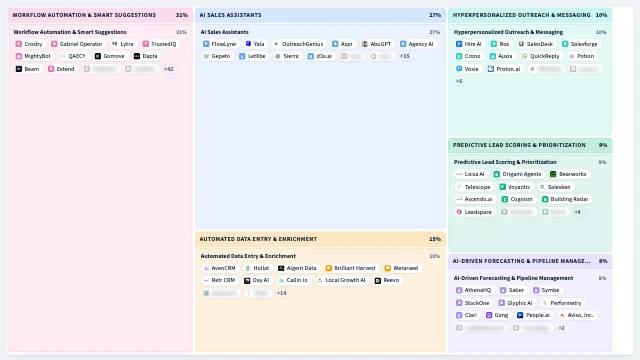
Where InMobi deploys vs peers
Each axis is a Dealroom topic tag — picked from the cluster's most-tagged themes. Values are normalized per axis: the peer with the highest tag-coverage on that axis sits at the edge, others scale relative to them. Toggle between M&A, venture, or both.
InMobi's portfolio, mapped.
See InMobi on the full Dealroom platform
Live deal flow, founder pedigree, hiring signals, revenue trajectory, and the full cap table.