 D
DataRobot
Enterprise AI platform for building and deploying models.
News
Knowledge graph
Open roles
DataRobot in the Boston ecosystem
The DataRobot office with the hot startups, most funded companies and investors around it. Hover or tap a pin.
Dealroom maps whole ecosystems like this one for cities, regions and governments. See the ecosystem platform →
Investors
From Dealroom's funding and investor records, grouped by the round each investor first entered.
Seed5 investors entered at this stage




Series A2 investors entered at this stage
- NLNew York Life
 NEA
Series B and later28 investors entered at this stage
 Morgan Stanley
 Accomplice
 Cisco Investments
 Plug and Play
 Tiger Global
 Meritech Capital
- SVServiceNow Ventures
 Salesforce Ventures
 Snowflake
 RTP Global
 T. Rowe Price
 Hone Capital
 Franklin Templeton Investments
- SVSnowflake Ventures
- Accomplice
 Altimeter Capital
- CIClearBridge Investments
 In-Q-Tel
 Glynn Capital Management
 DFJ Growth
 B Capital
 Intel Capital
 Sapphire Ventures
 Sutter Hill Ventures
 BlackRock
- CRCrossWork
- HPHP
 Silver Lake Partners
Source: Dealroom Talent Intelligence.
Alumni founders
Former DataRobot employees who went on to found companies, sorted by Dealroom signal score.
 John McGunnigleUnited States
 Dick SterkNetherlands
 Diego OppenheimerUnited States
 Jett OristaglioUnited States
 NCNeo CyberneticaEst. 2021
 Jeremy AchinUnited States
Patents
36 active patent families included in this estimate.
A patent family groups patent filings for the same invention. Source: Dealroom · PatSnap.
Investments and acquisitions
Disclosed deals where DataRobot was the backer or acquirer, 2017–2025. Toggle between venture rounds, M&A, or both. The map below is grouped by the target company's sector — the colored pill on each chip is the round type.
10 deals across DataRobot's capital deployment.
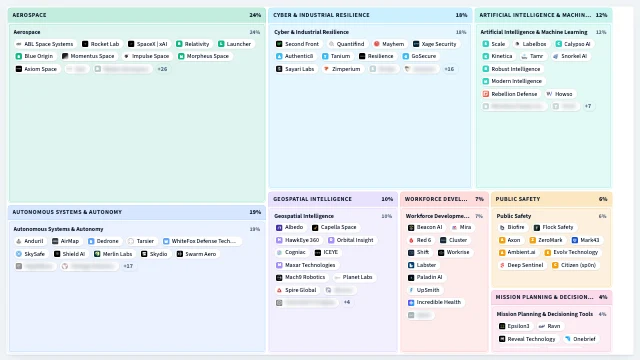
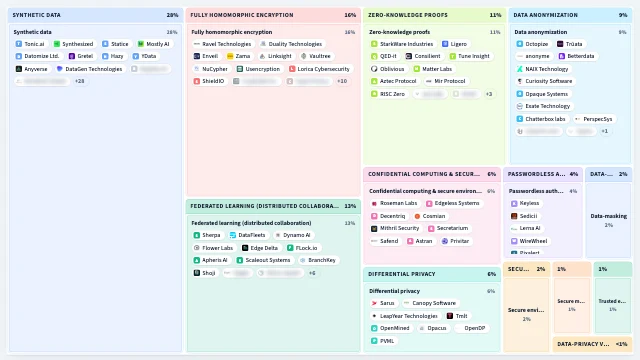
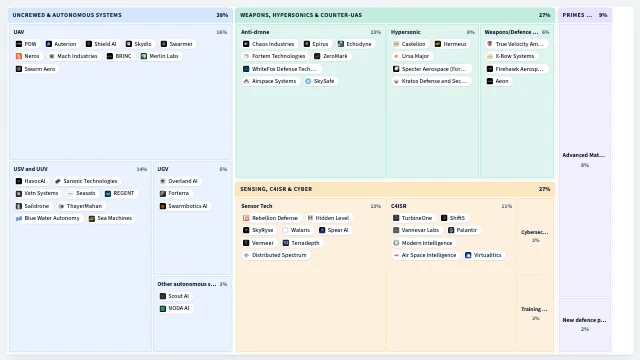
Where the deals concentrate by sector, stage, and decade.
Where DataRobot deploys vs peers
Each axis is a Dealroom topic tag — picked from the cluster's most-tagged themes. Values are normalized per axis: the peer with the highest tag-coverage on that axis sits at the edge, others scale relative to them. Toggle between M&A, venture, or both.
DataRobot's portfolio, mapped.
See DataRobot on the full Dealroom platform
Live deal flow, founder pedigree, hiring signals, revenue trajectory, and the full cap table.