 F
Forte
An end-to-end solution for token-based game economies and NFTs that benefits the community of developers, players, and fans alike
News
Open roles
Forte in the San Francisco ecosystem
The Forte office with the hot startups, most funded companies and investors around it. Hover or tap a pin.
Dealroom maps whole ecosystems like this one for cities, regions and governments. See the ecosystem platform →
Investors
From Dealroom's funding and investor records, grouped by the round each investor first entered.
Seed11 investors entered at this stage
- GVGreen Bay Ventures
- TCTransLink Capital
 Canaan
 Abstract Ventures
 Battery Ventures
- 1C1confirmation
- FEFred Ehrsam
 Coinbase Ventures
- TFThe House Fund
 Andreessen Horowitz
 Balaji Srinivasan
Series A2 investors entered at this stage
- UPUnion Grove Venture Partners
- GPGriffin Gaming Partners
Series B and later16 investors entered at this stage
 Overwolf
 Sea Group
- GIGalaxy Interactive
 Tiger Global
- SOSolana
- ZVZVentures
 Animoca Brands
- KMKora Management
- EVEOS VC
- PSPolygon Studios
- BIbig_bets
- SCSea Capital
- SCSea Capital
- WGWarner Music Group
 Playstudios
- GPGriffin Partners
Source: Dealroom Talent Intelligence.
Global footprint
Patents
10 active patent families included in this estimate.
A patent family groups patent filings for the same invention. Source: Dealroom · PatSnap.
Investments and acquisitions
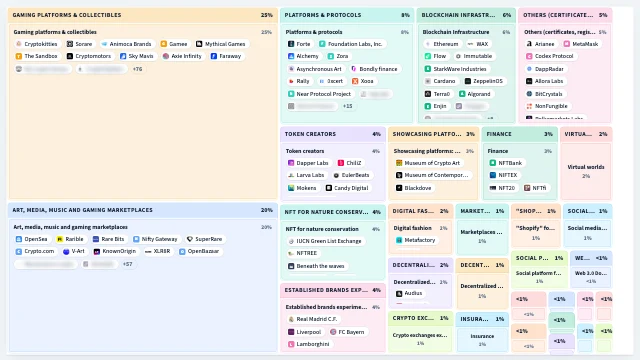
Disclosed deals where Forte was the backer or acquirer, 2021–2025. Toggle between venture rounds, M&A, or both. The map below is grouped by the target company's sector — the colored pill on each chip is the round type.
9 deals across Forte's capital deployment.
Where the deals concentrate by sector, stage, and decade.
Where Forte deploys vs peers
Each axis is a Dealroom topic tag — picked from the cluster's most-tagged themes. Values are normalized per axis: the peer with the highest tag-coverage on that axis sits at the edge, others scale relative to them. Toggle between M&A, venture, or both.
Forte's portfolio, mapped.
See Forte on the full Dealroom platform
Live deal flow, founder pedigree, hiring signals, revenue trajectory, and the full cap table.