 C
Chipper Cash
Offers instant cross-border mobile money transfers in Africa as easy as sending a text message
News
Open roles
Chipper Cash in the San Francisco ecosystem
The Chipper Cash office with the hot startups, most funded companies and investors around it. Hover or tap a pin.
Dealroom maps whole ecosystems like this one for cities, regions and governments. See the ecosystem platform →
Investors
From Dealroom's funding and investor records, grouped by the round each investor first entered.
Seed5 investors entered at this stage
 500 Global
- OVOne Way Ventures
 Liquid 2 Ventures
- TITransition Level Investments
- DCDeciens Capital
Series A1 investor entered at this stage
- RGRaptor Group
Series B and later7 investors entered at this stage
 Tribe Capital
- BVBrue2 Ventures
 Ribbit Capital
- STStandard Treasury
 FTX
- SCSVB Capital
 Bezos Expeditions
Source: Dealroom Talent Intelligence.
Patents
1 active patent families included in this estimate.
A patent family groups patent filings for the same invention. Source: Dealroom · PatSnap.
Investments and acquisitions
Disclosed deals where Chipper Cash was the backer or acquirer, 2022–2022. Toggle between venture rounds, M&A, or both. The map below is grouped by the target company's sector — the colored pill on each chip is the round type.
3 deals across Chipper Cash's capital deployment.
Where the deals concentrate by sector, stage, and decade.
Where Chipper Cash deploys vs peers
Each axis is a Dealroom topic tag — picked from the cluster's most-tagged themes. Values are normalized per axis: the peer with the highest tag-coverage on that axis sits at the edge, others scale relative to them. Toggle between M&A, venture, or both.
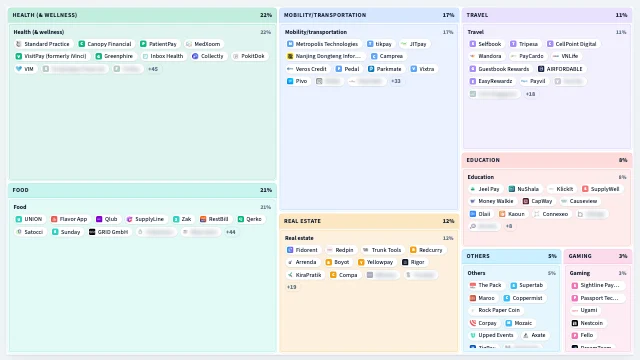
Chipper Cash's portfolio, mapped.
See Chipper Cash on the full Dealroom platform
Live deal flow, founder pedigree, hiring signals, revenue trajectory, and the full cap table.