 M
M
Microsoft
Enterprise software, cloud solutions, and personal computing
At a glance
- Status
- Listed
- Founded
- 1975
- Headquarters
- Redmond, United States
- Listing
- IPO 1986
- Sector
- Other B2B Software
- Power Law
- Magnificent 7Power Law dataset 2026
Knowledge graph
 News
Microsoft's Nadella calls for human-controlled AI 'emergency brake'
Oct 11, 2026
News
Microsoft's Nadella calls for human-controlled AI 'emergency brake'
Oct 11, 2026
 News
Microsoft launches Microsoft-Decision-1, a fast decision-scoring model built on Alibaba's Qwen
Oct 10, 2026
News
Microsoft launches Microsoft-Decision-1, a fast decision-scoring model built on Alibaba's Qwen
Oct 10, 2026
 News
US suspends Microsoft, Adobe and six IT services firms from green-card sponsorship (PERM) over alleged visa abuse
Oct 9, 2026
Analysis
Personal AI agents are back: nine big tech launches and 21 startups raising money in 2026
Sep 30, 2026
Analysis
The Magnificent 7 are in 45% of 2026’s venture dollars
Sep 10, 2026
News
US suspends Microsoft, Adobe and six IT services firms from green-card sponsorship (PERM) over alleged visa abuse
Oct 9, 2026
Analysis
Personal AI agents are back: nine big tech launches and 21 startups raising money in 2026
Sep 30, 2026
Analysis
The Magnificent 7 are in 45% of 2026’s venture dollars
Sep 10, 2026
 Market map
NYC AI Map by Lux Capital
Market map
NYC AI Map by Lux Capital
More headlines
Investors
From Dealroom's funding and investor records, grouped by the round each investor first entered.
Series A1 investor entered at this stage
- TITechnology Venture Investors
Source: Dealroom Talent Intelligence.
Alumni founders
Former Microsoft employees who went on to found companies, sorted by Dealroom signal score.
 DUDuolingoEst. 2011
 Severin HackerUnited States
 ABAbridgeEst. 2018
 Zachary LiptonUnited States
 BLBlockstreamEst. 2014
 Adam BackUnited States
 INInstagramEst. 2010
 Mike KriegerUnited States
 OPOpenAIEst. 2015
 Pamela VagataUnited States
Global footprint
across markets
Investments and acquisitions
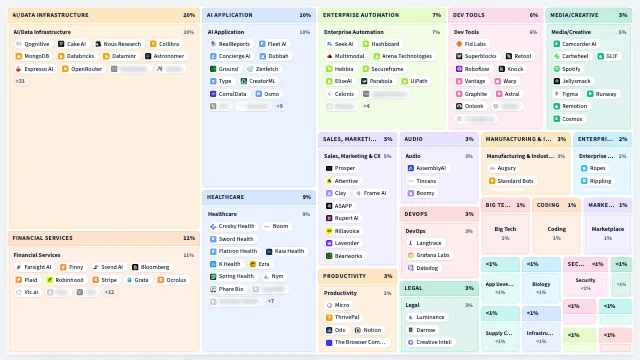
Disclosed deals where Microsoft was the backer or acquirer, 1987–2026. Toggle between venture rounds, M&A, or both. The map below is grouped by the target company's sector — the colored pill on each chip is the round type.
728 deals across Microsoft's capital deployment.
Where the deals concentrate by sector, stage, and decade.
Microsoft's portfolio, mapped.
Market sentiment
An AI-synthesised read of the highest-engagement posts about Microsoft on X, ranked by likes and reposts, corporate channels excluded.
Reading the room on X — pulling top posts and synthesizing themes…
Source: X recent search ranked by engagement (likes + retweets) · Synthesis by Claude · Cached for 1 hour
See Microsoft on the full Dealroom platform
Live deal flow, founder pedigree, hiring signals, revenue trajectory, and the full cap table.