Top 250 — Alphabetical
The 250 highest-scoring Power Law investors of 2026, sorted A→Z. 4:5 portrait for LinkedIn feeds.
Venture returns follow a power law, only the top investors truly bend the curve. Our eighth annual Power Law Investor Ranking shows who they are, built on Dealroom's proprietary data and a scoring model that rewards outcomes, not hype.
100% Transparent, 100% Quantitative
Investors earn points for each portfolio company that reaches a major milestone. Earlier stages and bigger outcomes are worth more.
Showing investors of type , ranked by .
Compare VCs
Select investors, region, time basis and outcome type to compare annual or cumulative power-law results.
Pick investors below to compare new or cumulative outcome curves.
Hover any chart segment to see its category and points.
Already a Dealroom customer? Open the full ranking →
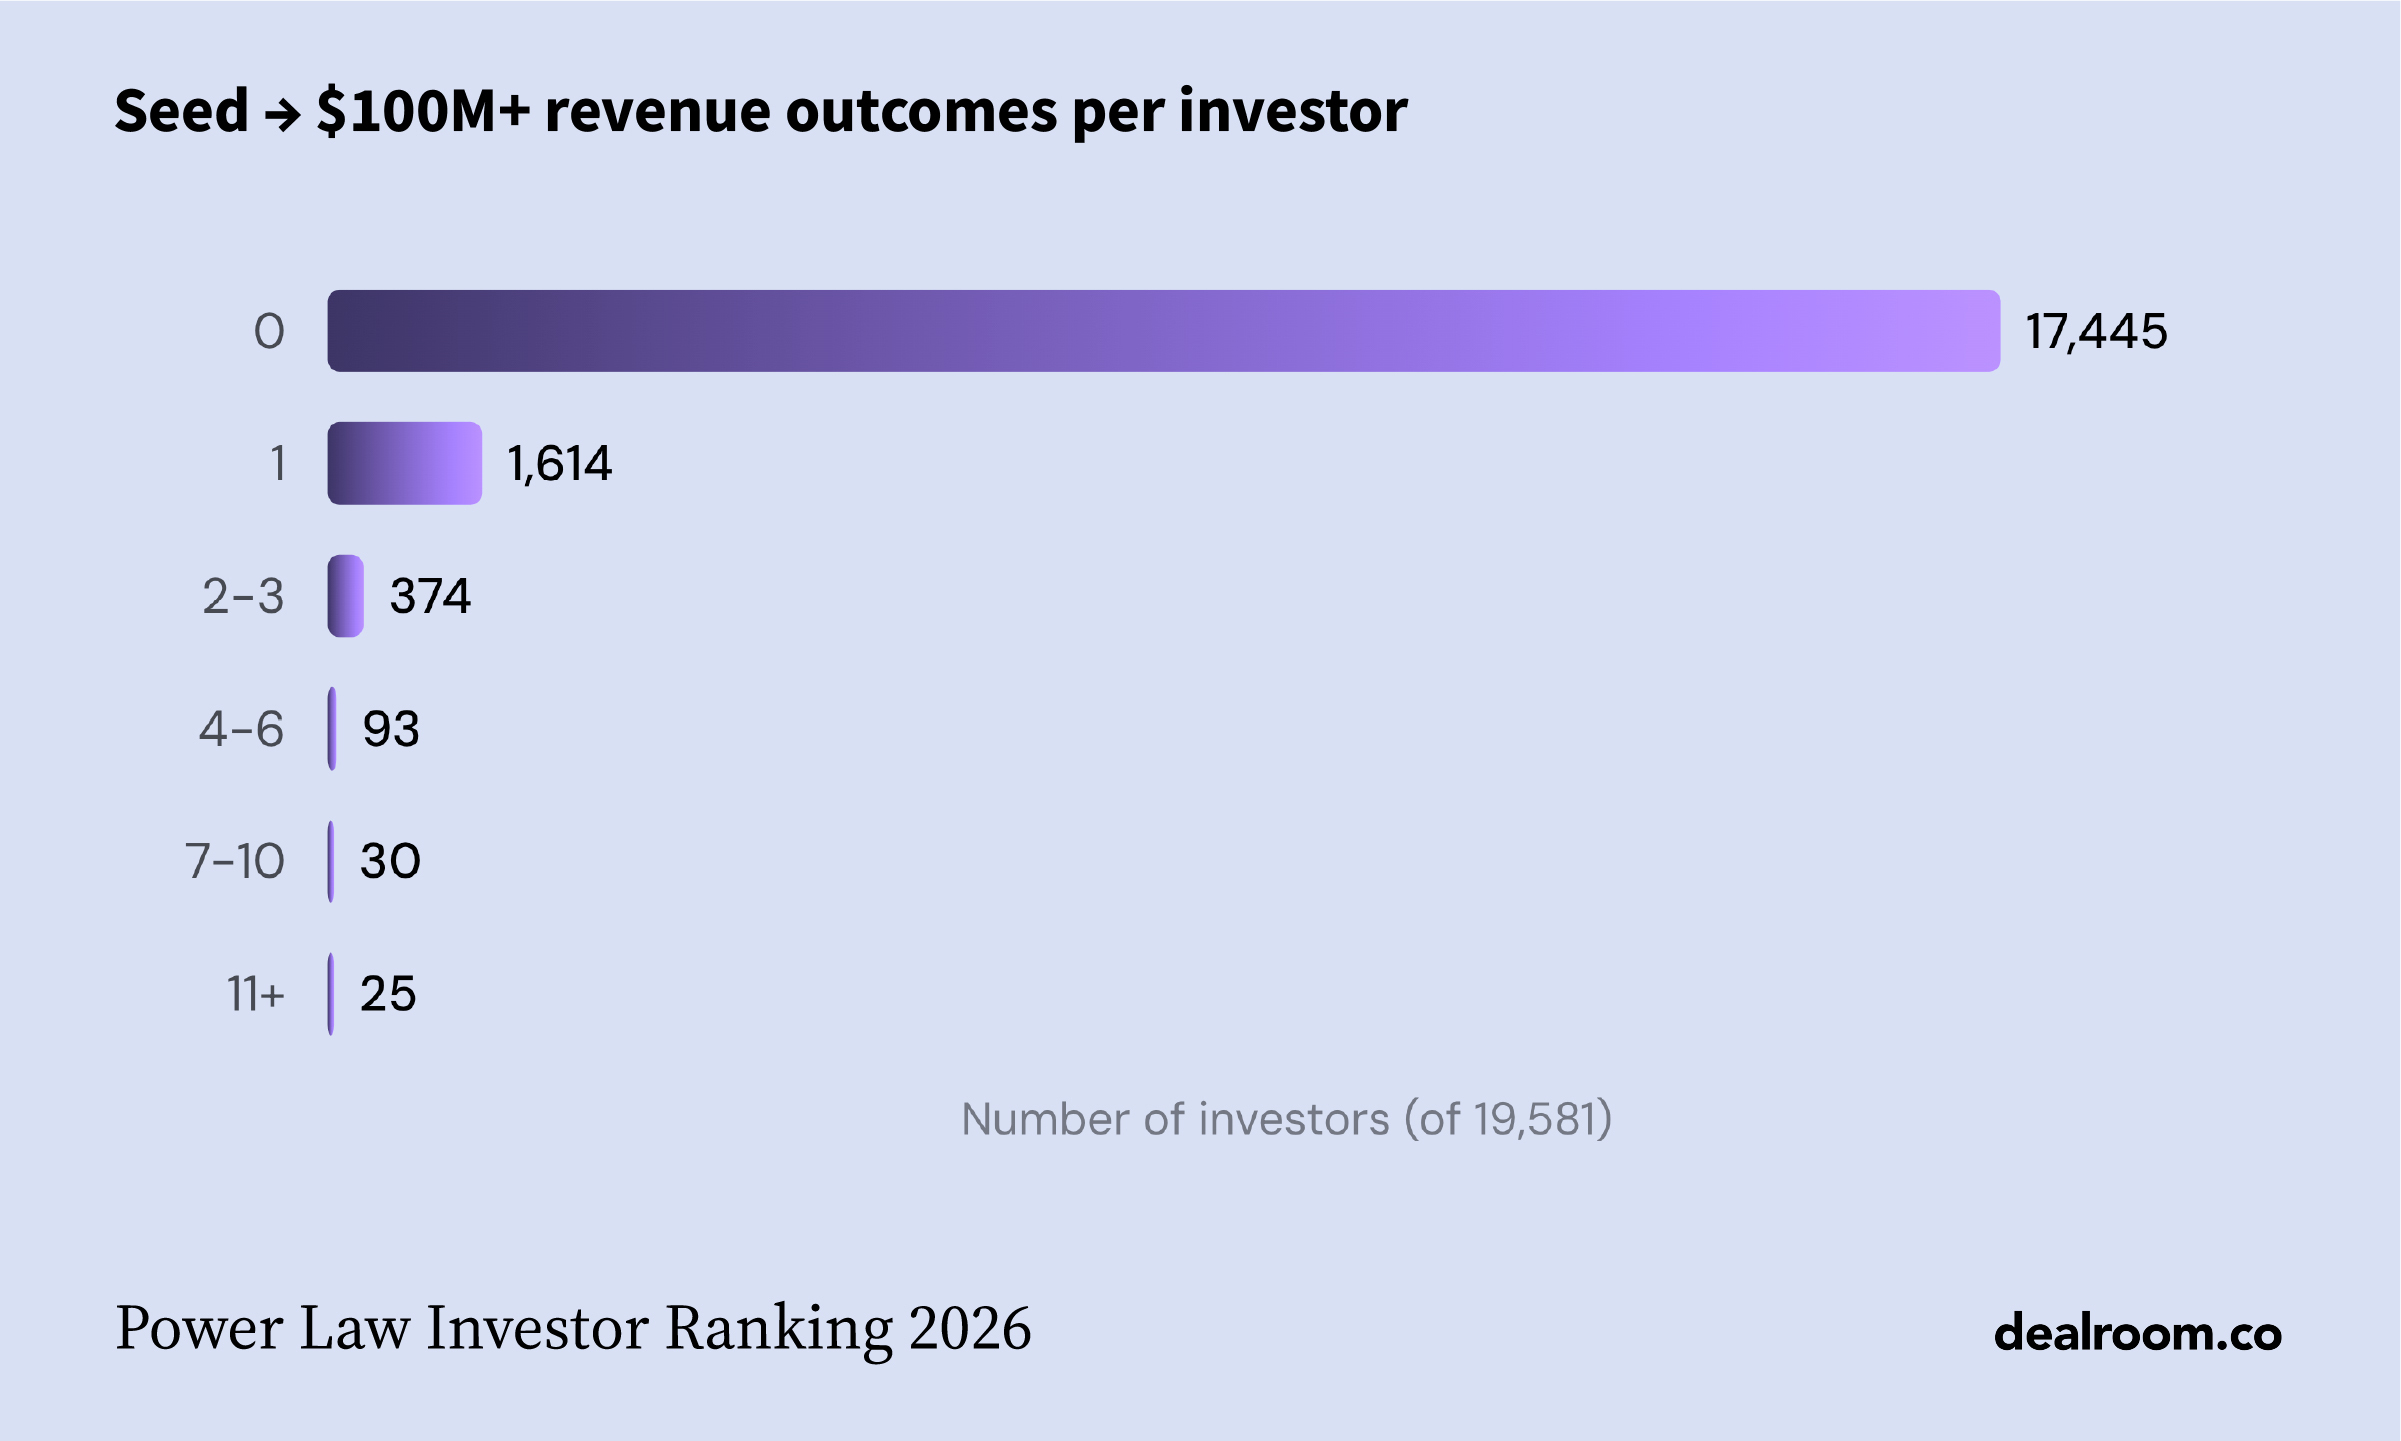
Just ~1.5% of VC-backed startups ever reach $100M+ in revenue, so backing even one is rare. Of the 20,742 investors with a power-law outcome in this market, only 2,328 (11%) have ever seeded a company that reached $100M+ revenue. 1,754 of those stopped at one; just 28 have done it more than ten times.
That concentration is why our scoring model weights outcomes, not brand or AUM.
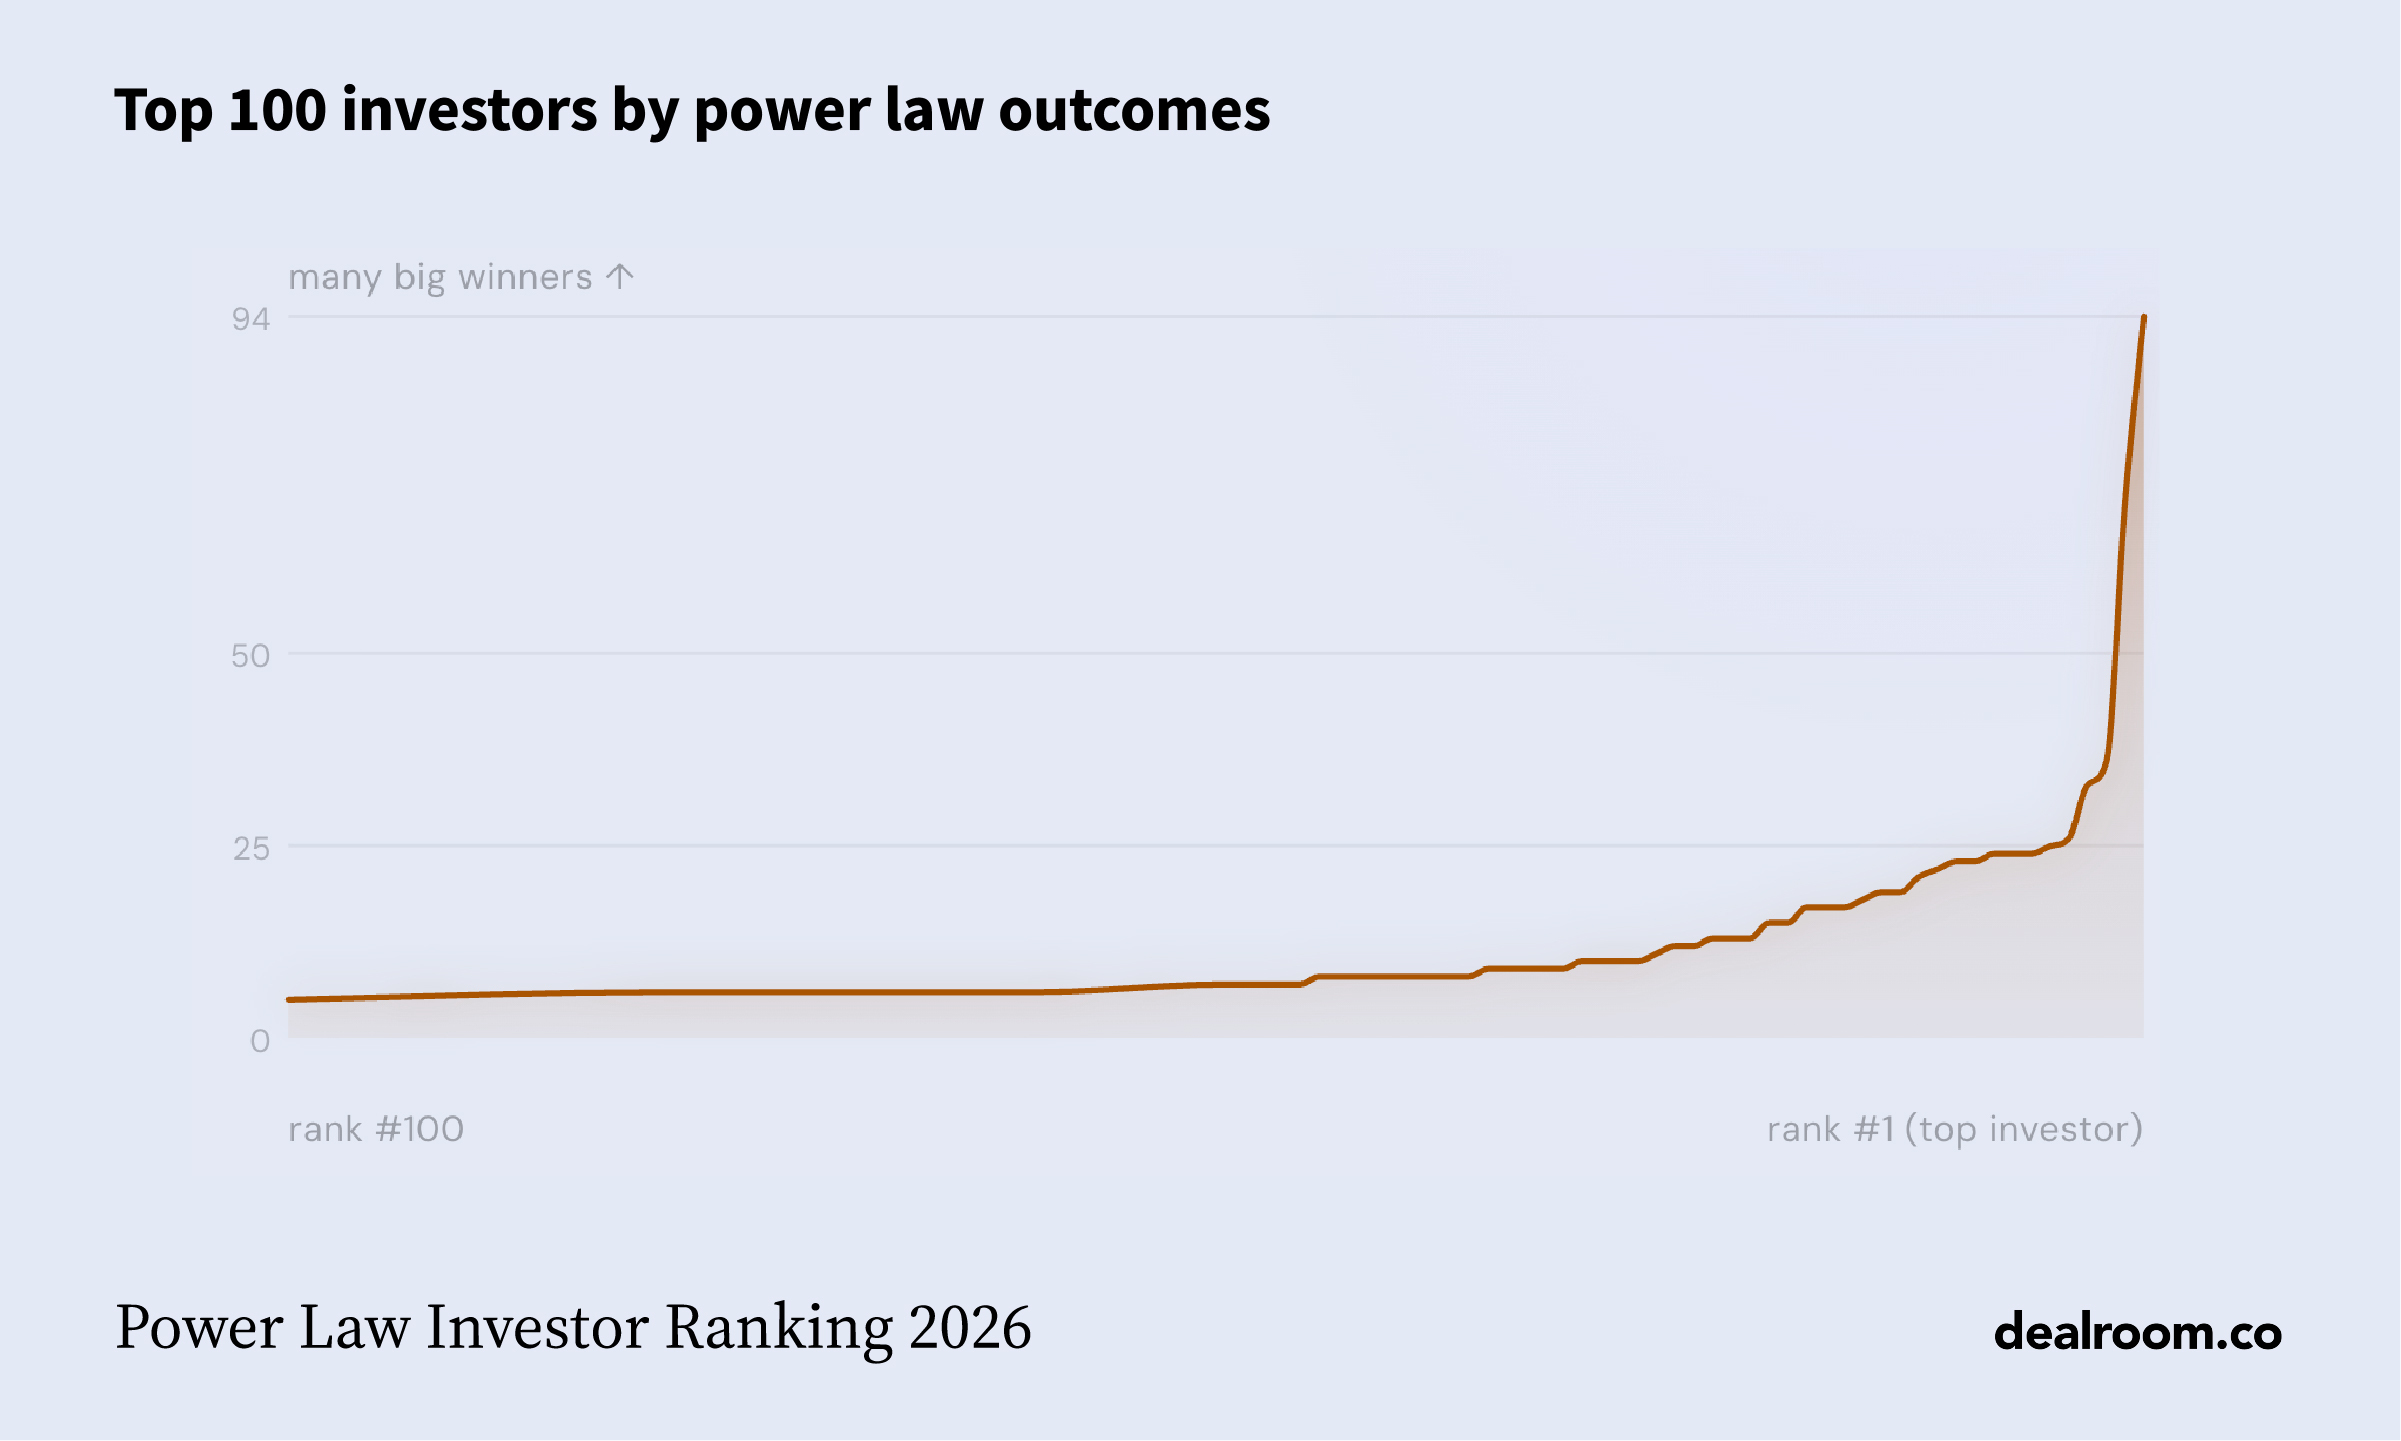
Of the 3,653 companies in this data that reached a $1B valuation, 47% have at least one of the top 25 investors on the cap table. The top 100 — half a percent of the field — cover 71%. A unicorn counts once, however many of them co-invested.
A venture allocation that misses this tier misses most of the outcomes.
Winner takes most
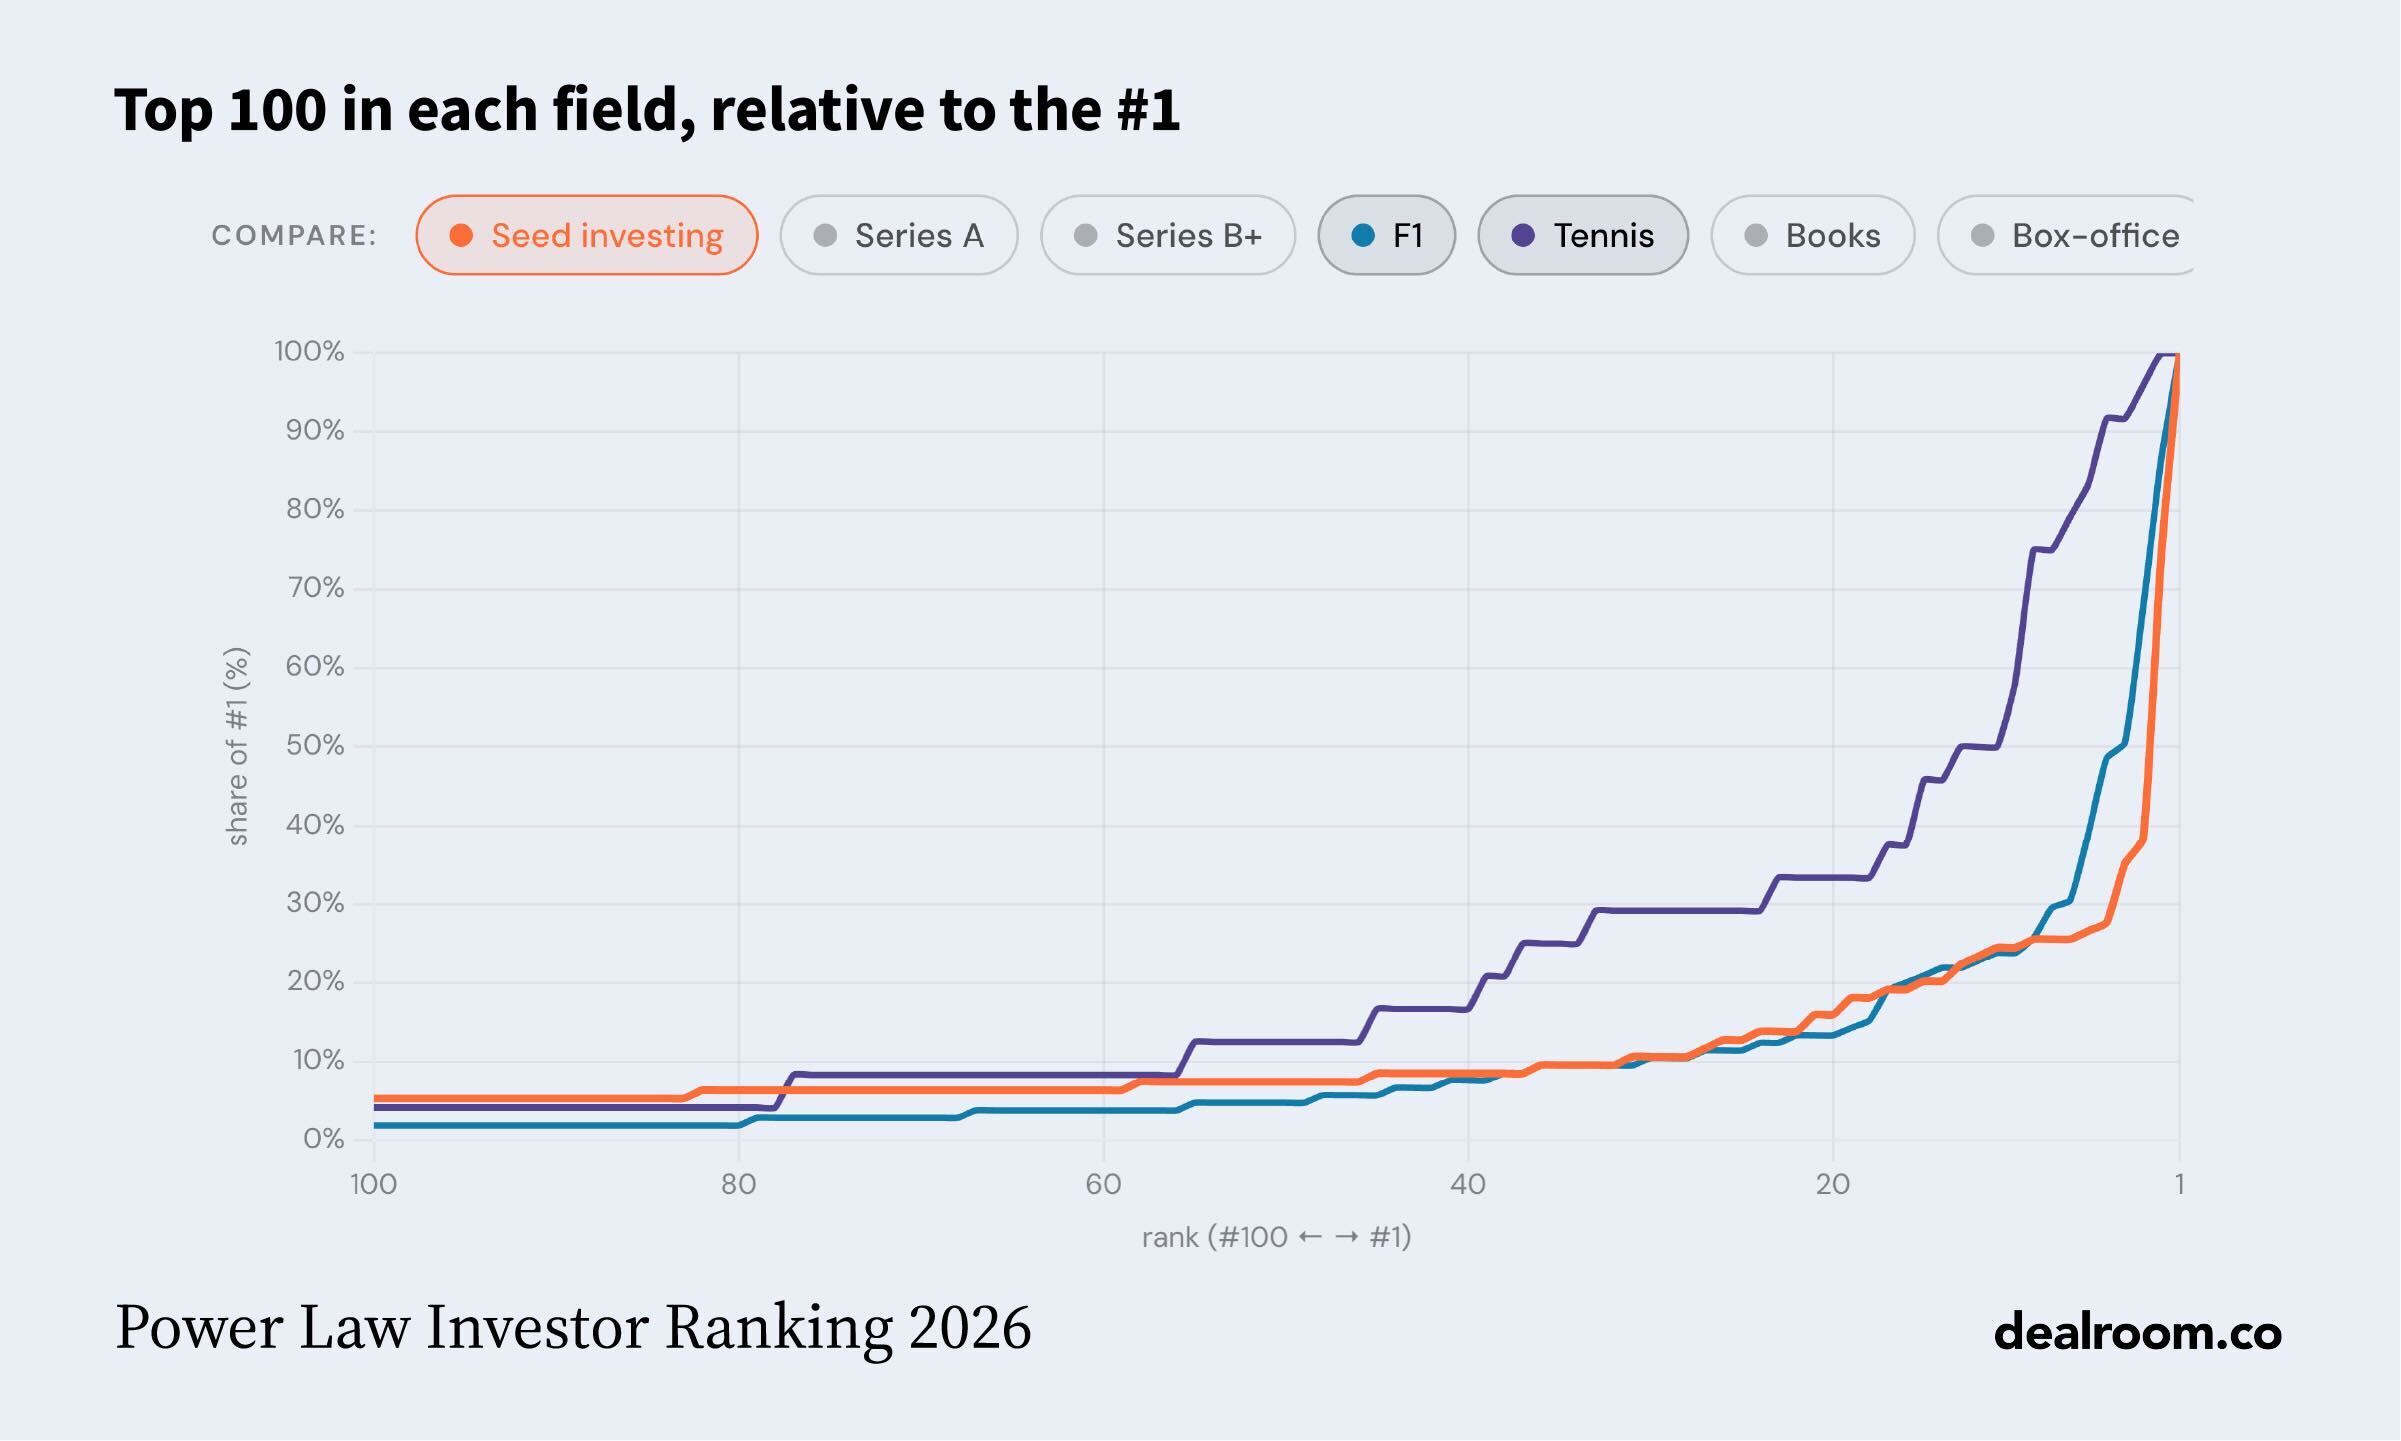
Y Combinator has seeded 140 companies that went on to $100M+ revenue. 500 Global, second on the list, has 43. Formula One is much closer at the top: Lewis Hamilton has 105 wins to Michael Schumacher's 91. Tennis is closer still — Margaret Court has as many Grand Slam titles as Novak Djokovic.
Each curve takes the top 100 of a field and plots what every rank captured as a share of its leader. Hover a curve for the names.
| Field | Top 100 ranked by | Total winners | Total field |
|---|---|---|---|
| Seed investors | $100M+ revenue companies seeded | 2,328$100M+ revenue companies | 20,742seed investors (VCs, accelerators, angels) |
| F1 | Career Grand Prix wins | 1,155Grand Prix wins | ~770drivers ever |
| Tennis | Singles Grand Slam titles (men + women) | ~960Grand Slam titles awarded | ~270unique winners (men + women) |
| Books | Lifetime book sales (M copies, est.) | ~170Mbooks ever published | millionsauthors with at least one |
| Box-office | Cumulative worldwide gross ($M) | ~$300Bglobal box-office, modern era | ~10,000+credited feature directors |
| Science | Lifetime Google Scholar citations | ~60Mpapers indexed | millionsauthors with at least one paper |
| Music | Certified record sales (M units) | ~hundreds of Malbums + singles released | millionsrecording artists |
Benchmarking the skew
Venture's power law is famously extreme. Put it next to other winner-take-most domains — Formula 1, Grand Slam tennis, Ballon d'Or, NBA — and the single top investor in the world actually owns a smaller share of all outcomes than the top athlete in any of them.
The reason is pool size. 20,742 investors have made Seed investments in our dataset; only 770 drivers have ever raced in F1. When the field is orders of magnitude bigger, even the most dominant player captures a thinner slice.
The cliff, though, is universal. 89.1% of VC investors have never produced a Seed → $100M+ winner — almost identical to the 85.0% of F1 drivers who have never won a Grand Prix. The zero-outcome base is common to every power-law domain. The dynasty ceiling is what differs.
Sources: Dealroom Power Law Ranking 2026; Wikipedia (F1 race winners, Open Era men's singles champions, Ballon d'Or, NBA champions).
The investor universe
What does the active VC base actually look like — by deal volume, type, first round, fund size, and assets under management. Toggle any chart to compare active VCs against the full investor universe.
The simple answer depends on how strict the definition is. If “VC” means dedicated venture capital firm, Dealroom tracks roughly 8,600 firms with venture activity since 1990, of which about 4,900 are active. If it means the broader venture-capital ecosystem — VC firms, corporate venture arms, angels, micro-VCs, accelerators and crossover investors — the universe is closer to 19,600 investors, with about 9,500 still active.
Distribution of investors by total deals done since 1990
Distribution of investors by category and the round they typically enter at
Distribution of investors by latest fund size and total AuM
How we built the Power Law Investor Ranking
Two-thirds of all points come from revenue milestones (Thoroughbreds + Colts). Valuation-based outcomes (Unicorns + $1B exits) make up the remaining third.
For each outcome company, we tag the earliest round where each investor participated (Seed, A, B, etc.). Earlier entries earn more credit. Late-stage entries get less. This "stage weighting" has been used since Edition 3, so scores are comparable year to year.
Unicorn status signals market promise; revenue proves product-market fit. If a company hits both, it earns on both, because it shows both potential and proof.
We track ~25,000 investors globally: VCs, accelerators, CVCs, angel networks, and crossover funds. The table only includes those with at least one "Outcome" in the selected ecosystem.
Dealroom's public and proprietary data, company filings, press releases, and investor submissions. Tables update nightly. Scores are frozen annually for each official edition.
Share & Embed
Download high-resolution infographics for your articles, social posts, and slide decks. Free to share with attribution to dealroom.co.
Editorial graphics from the Power Law Investor Ranking 2026 media kit.
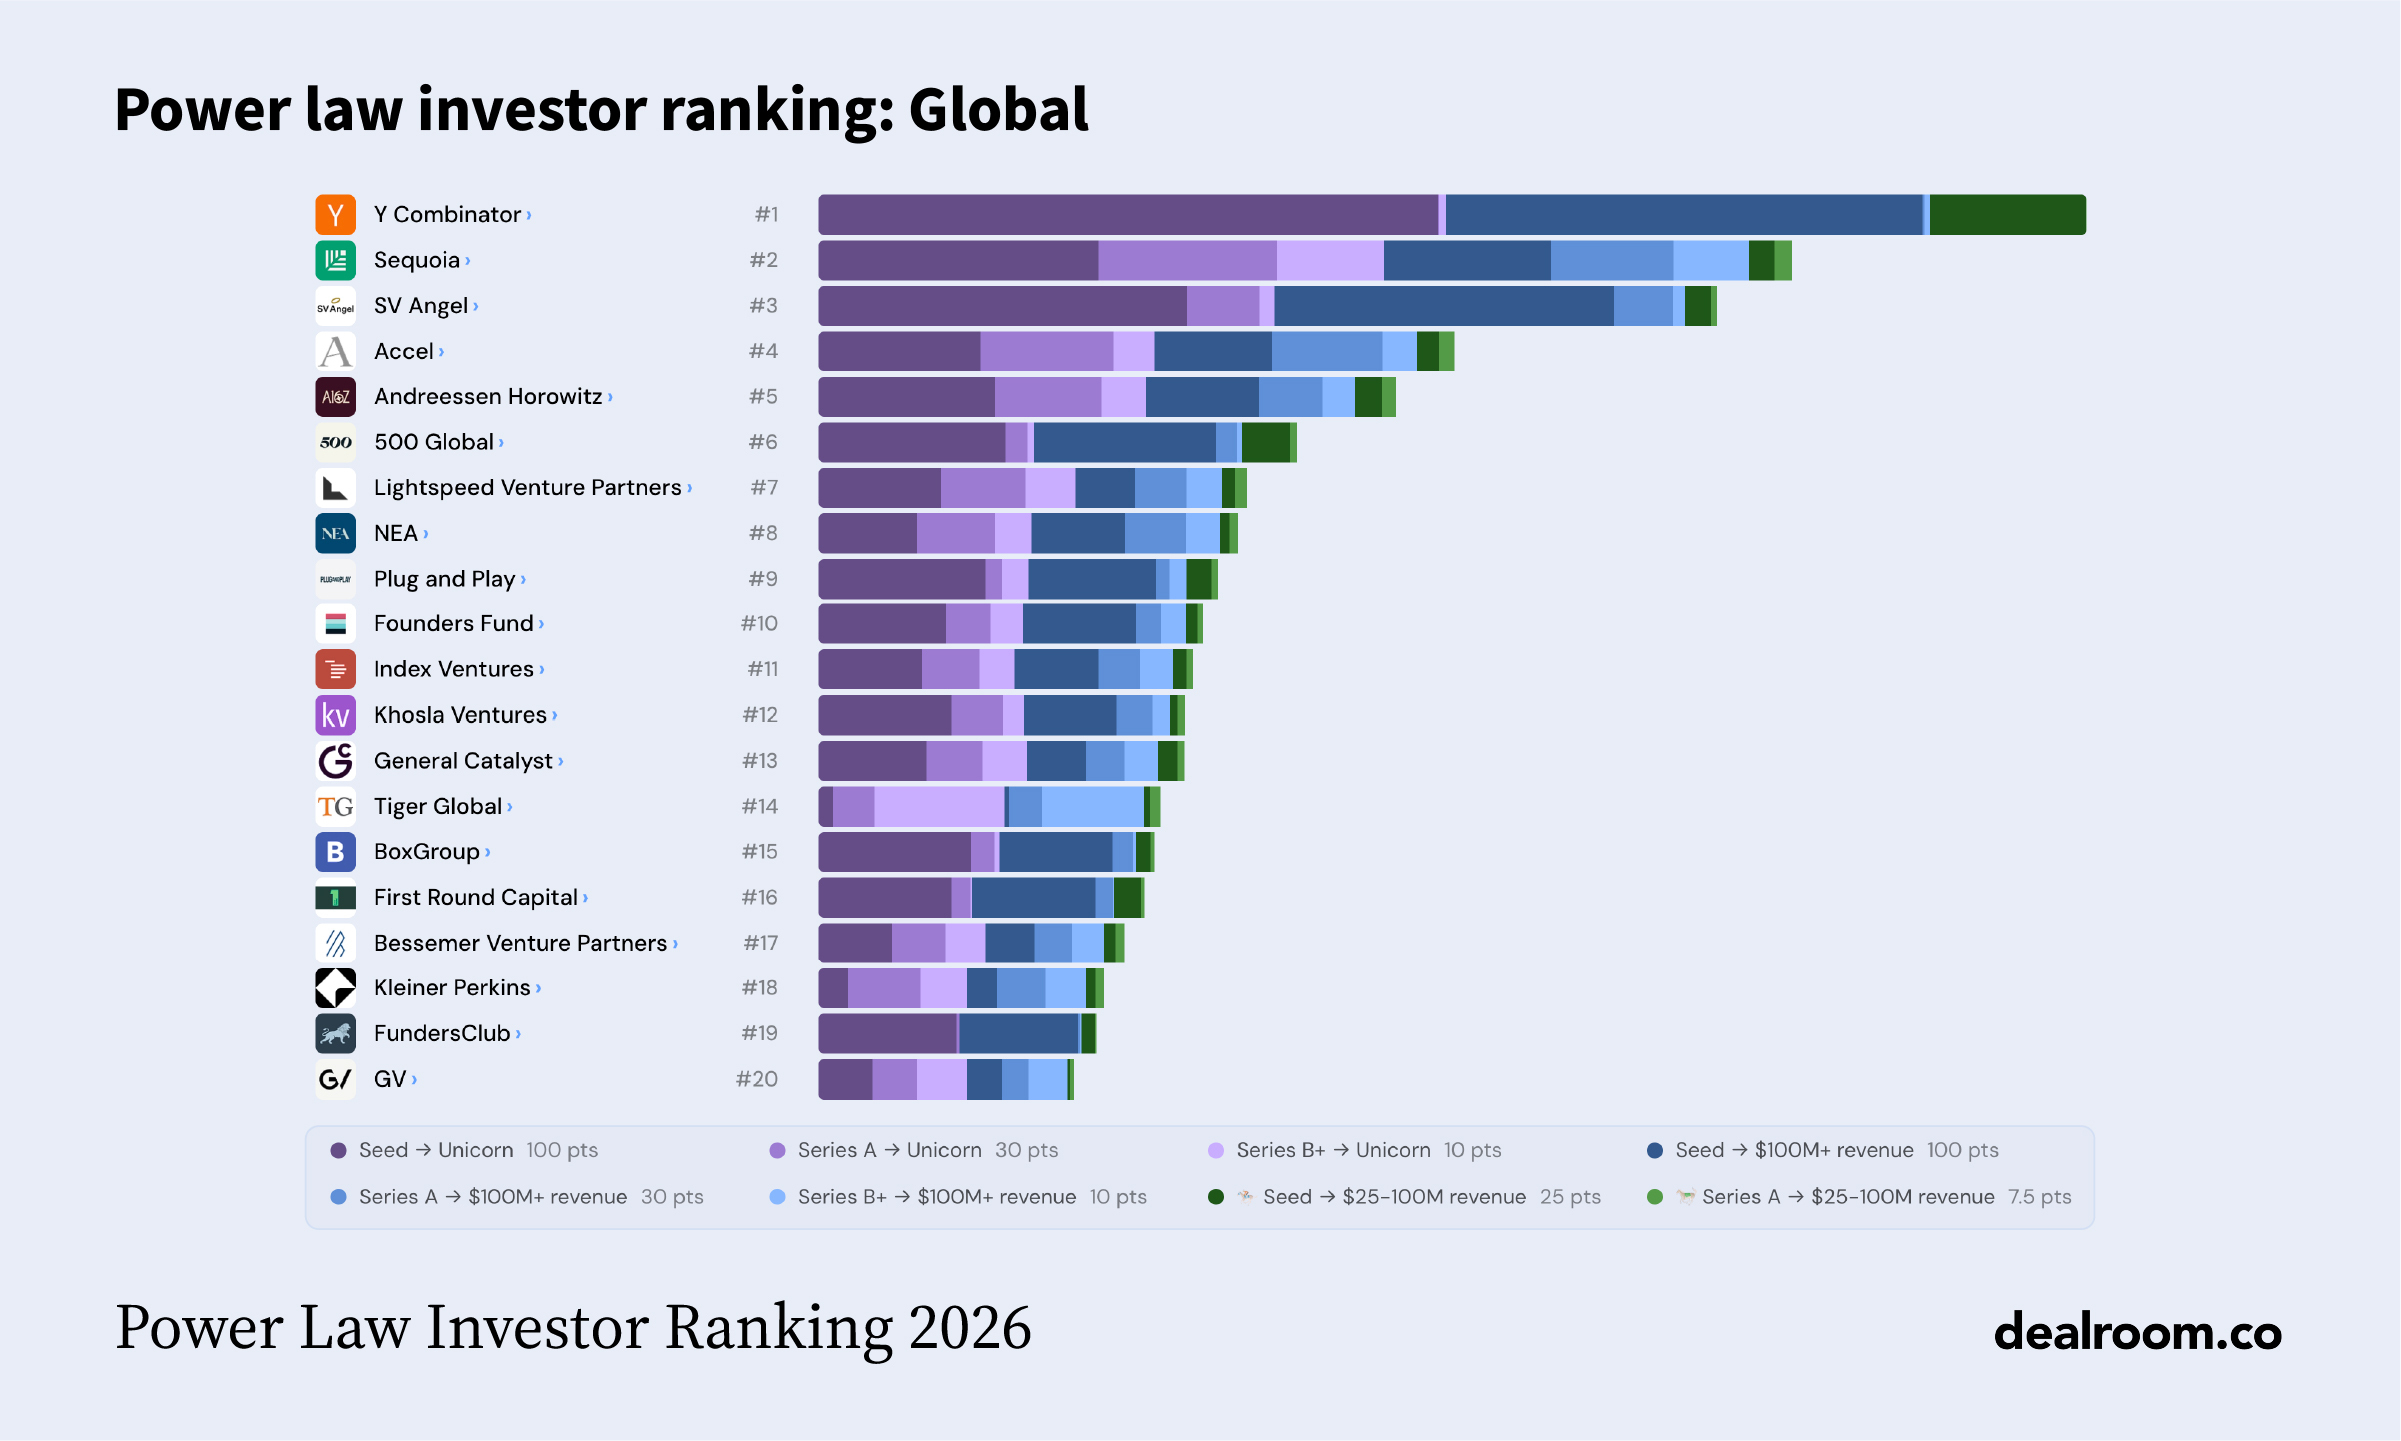
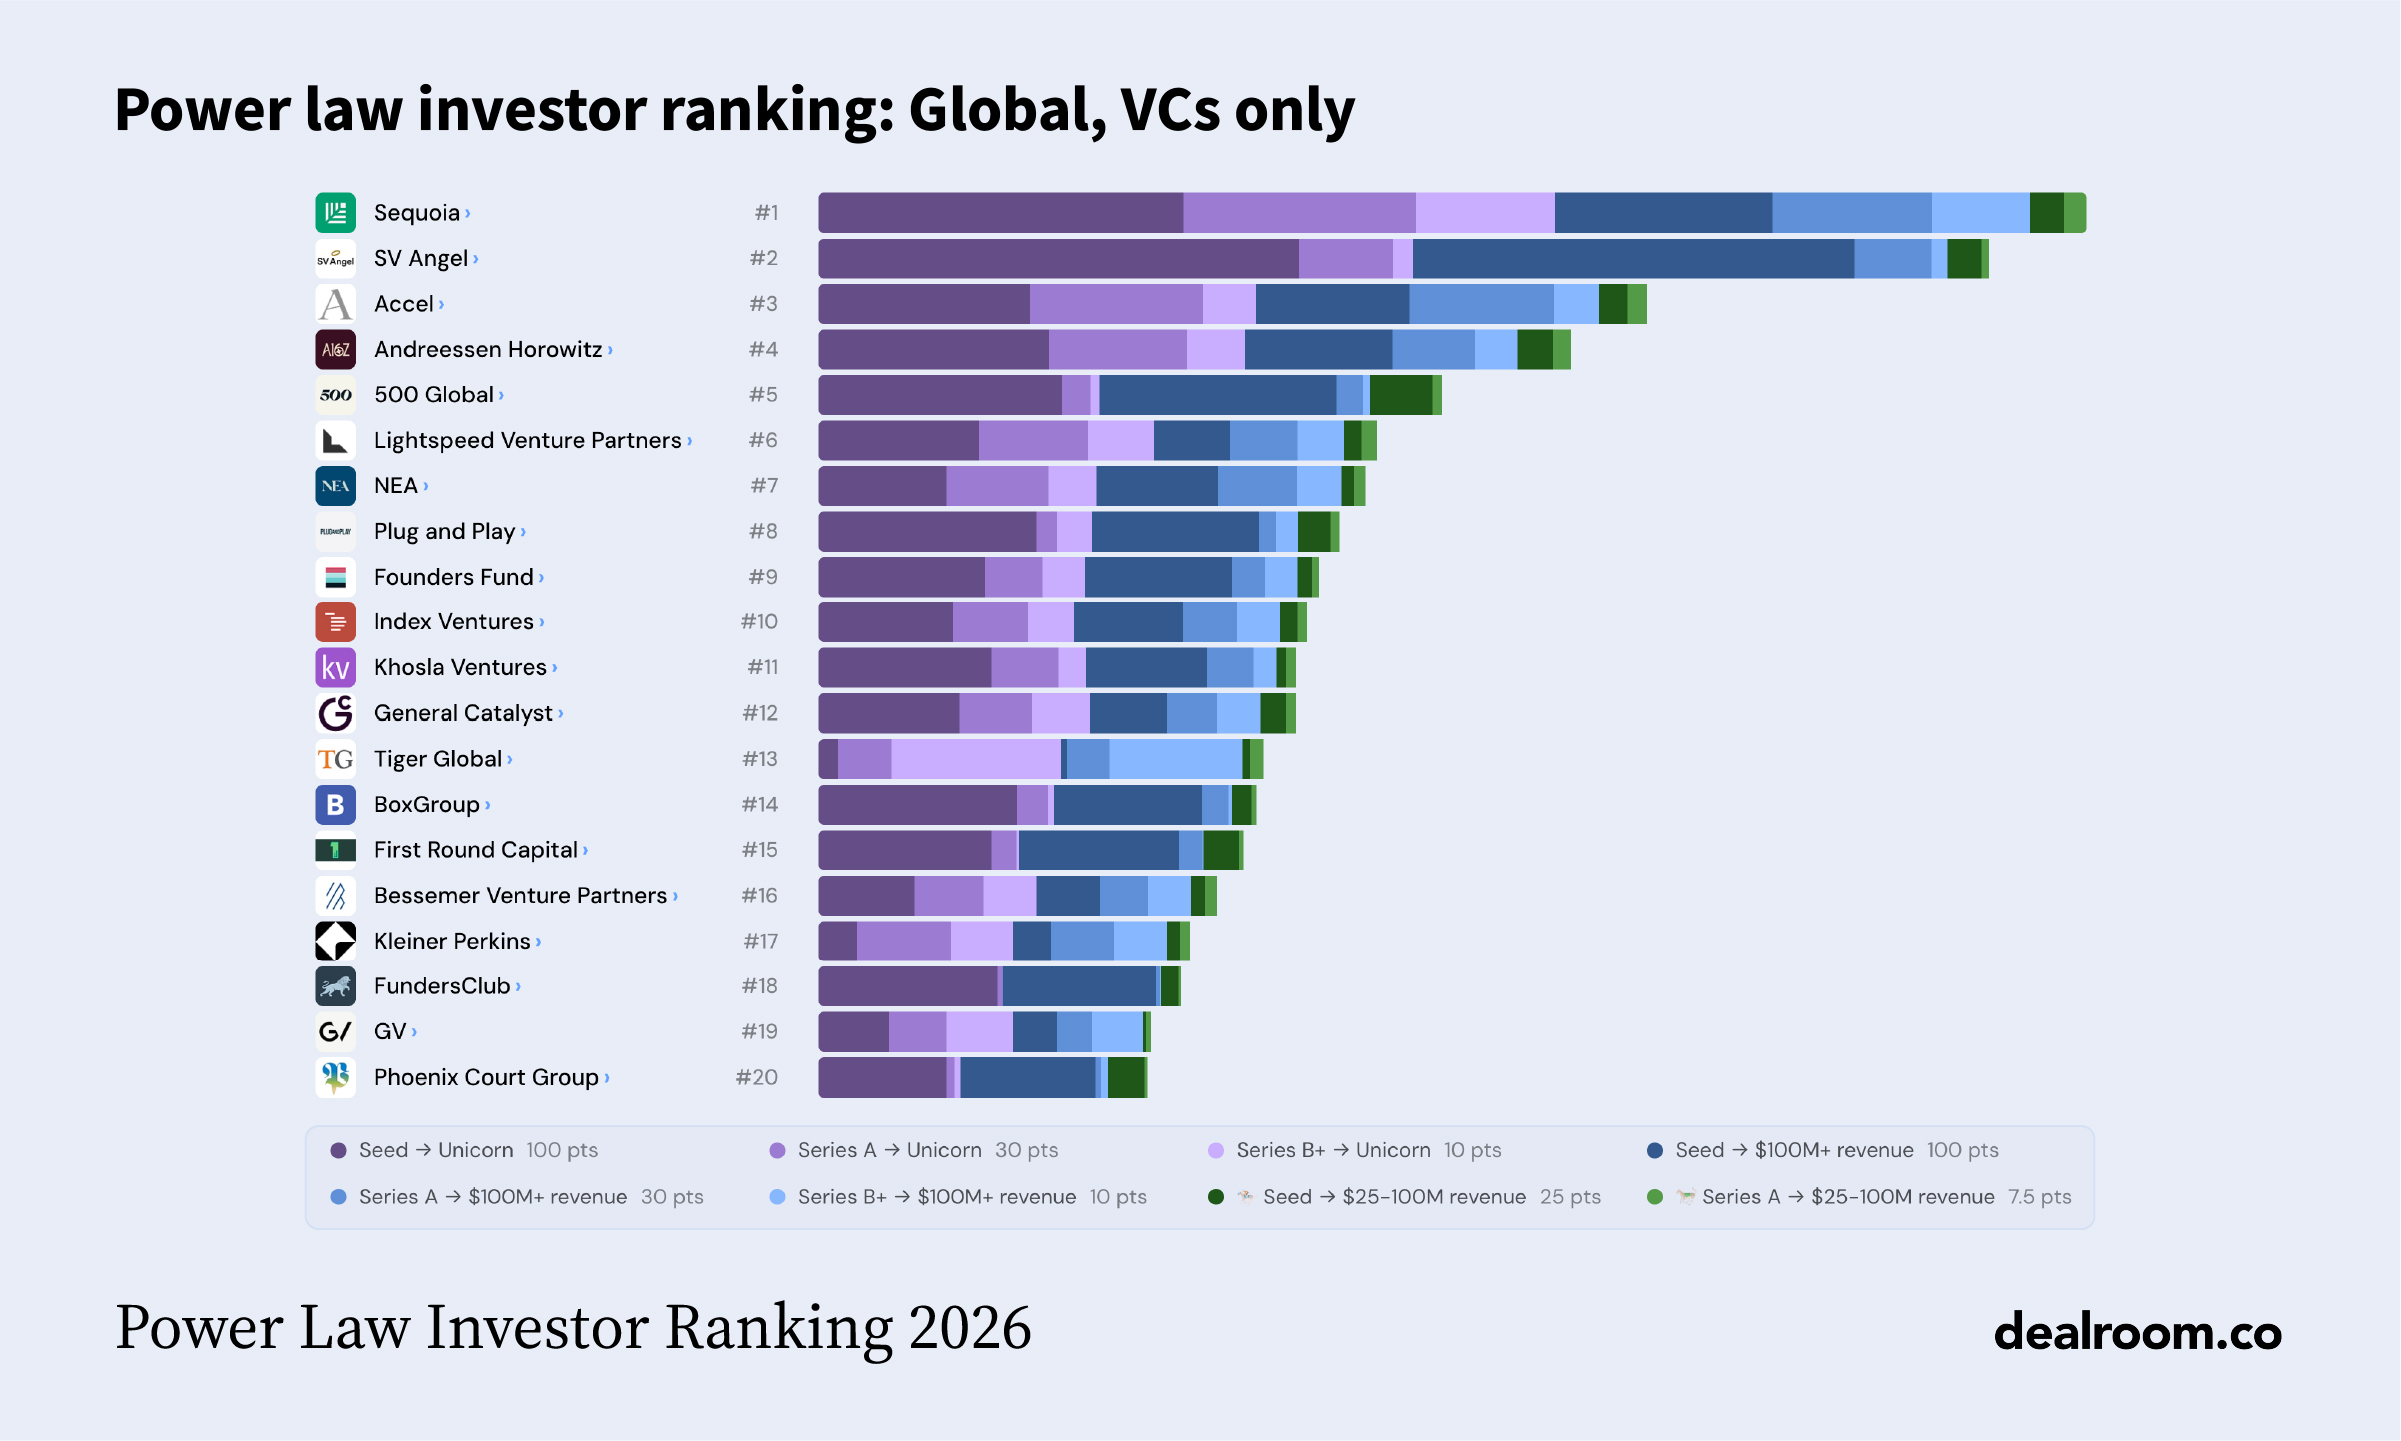
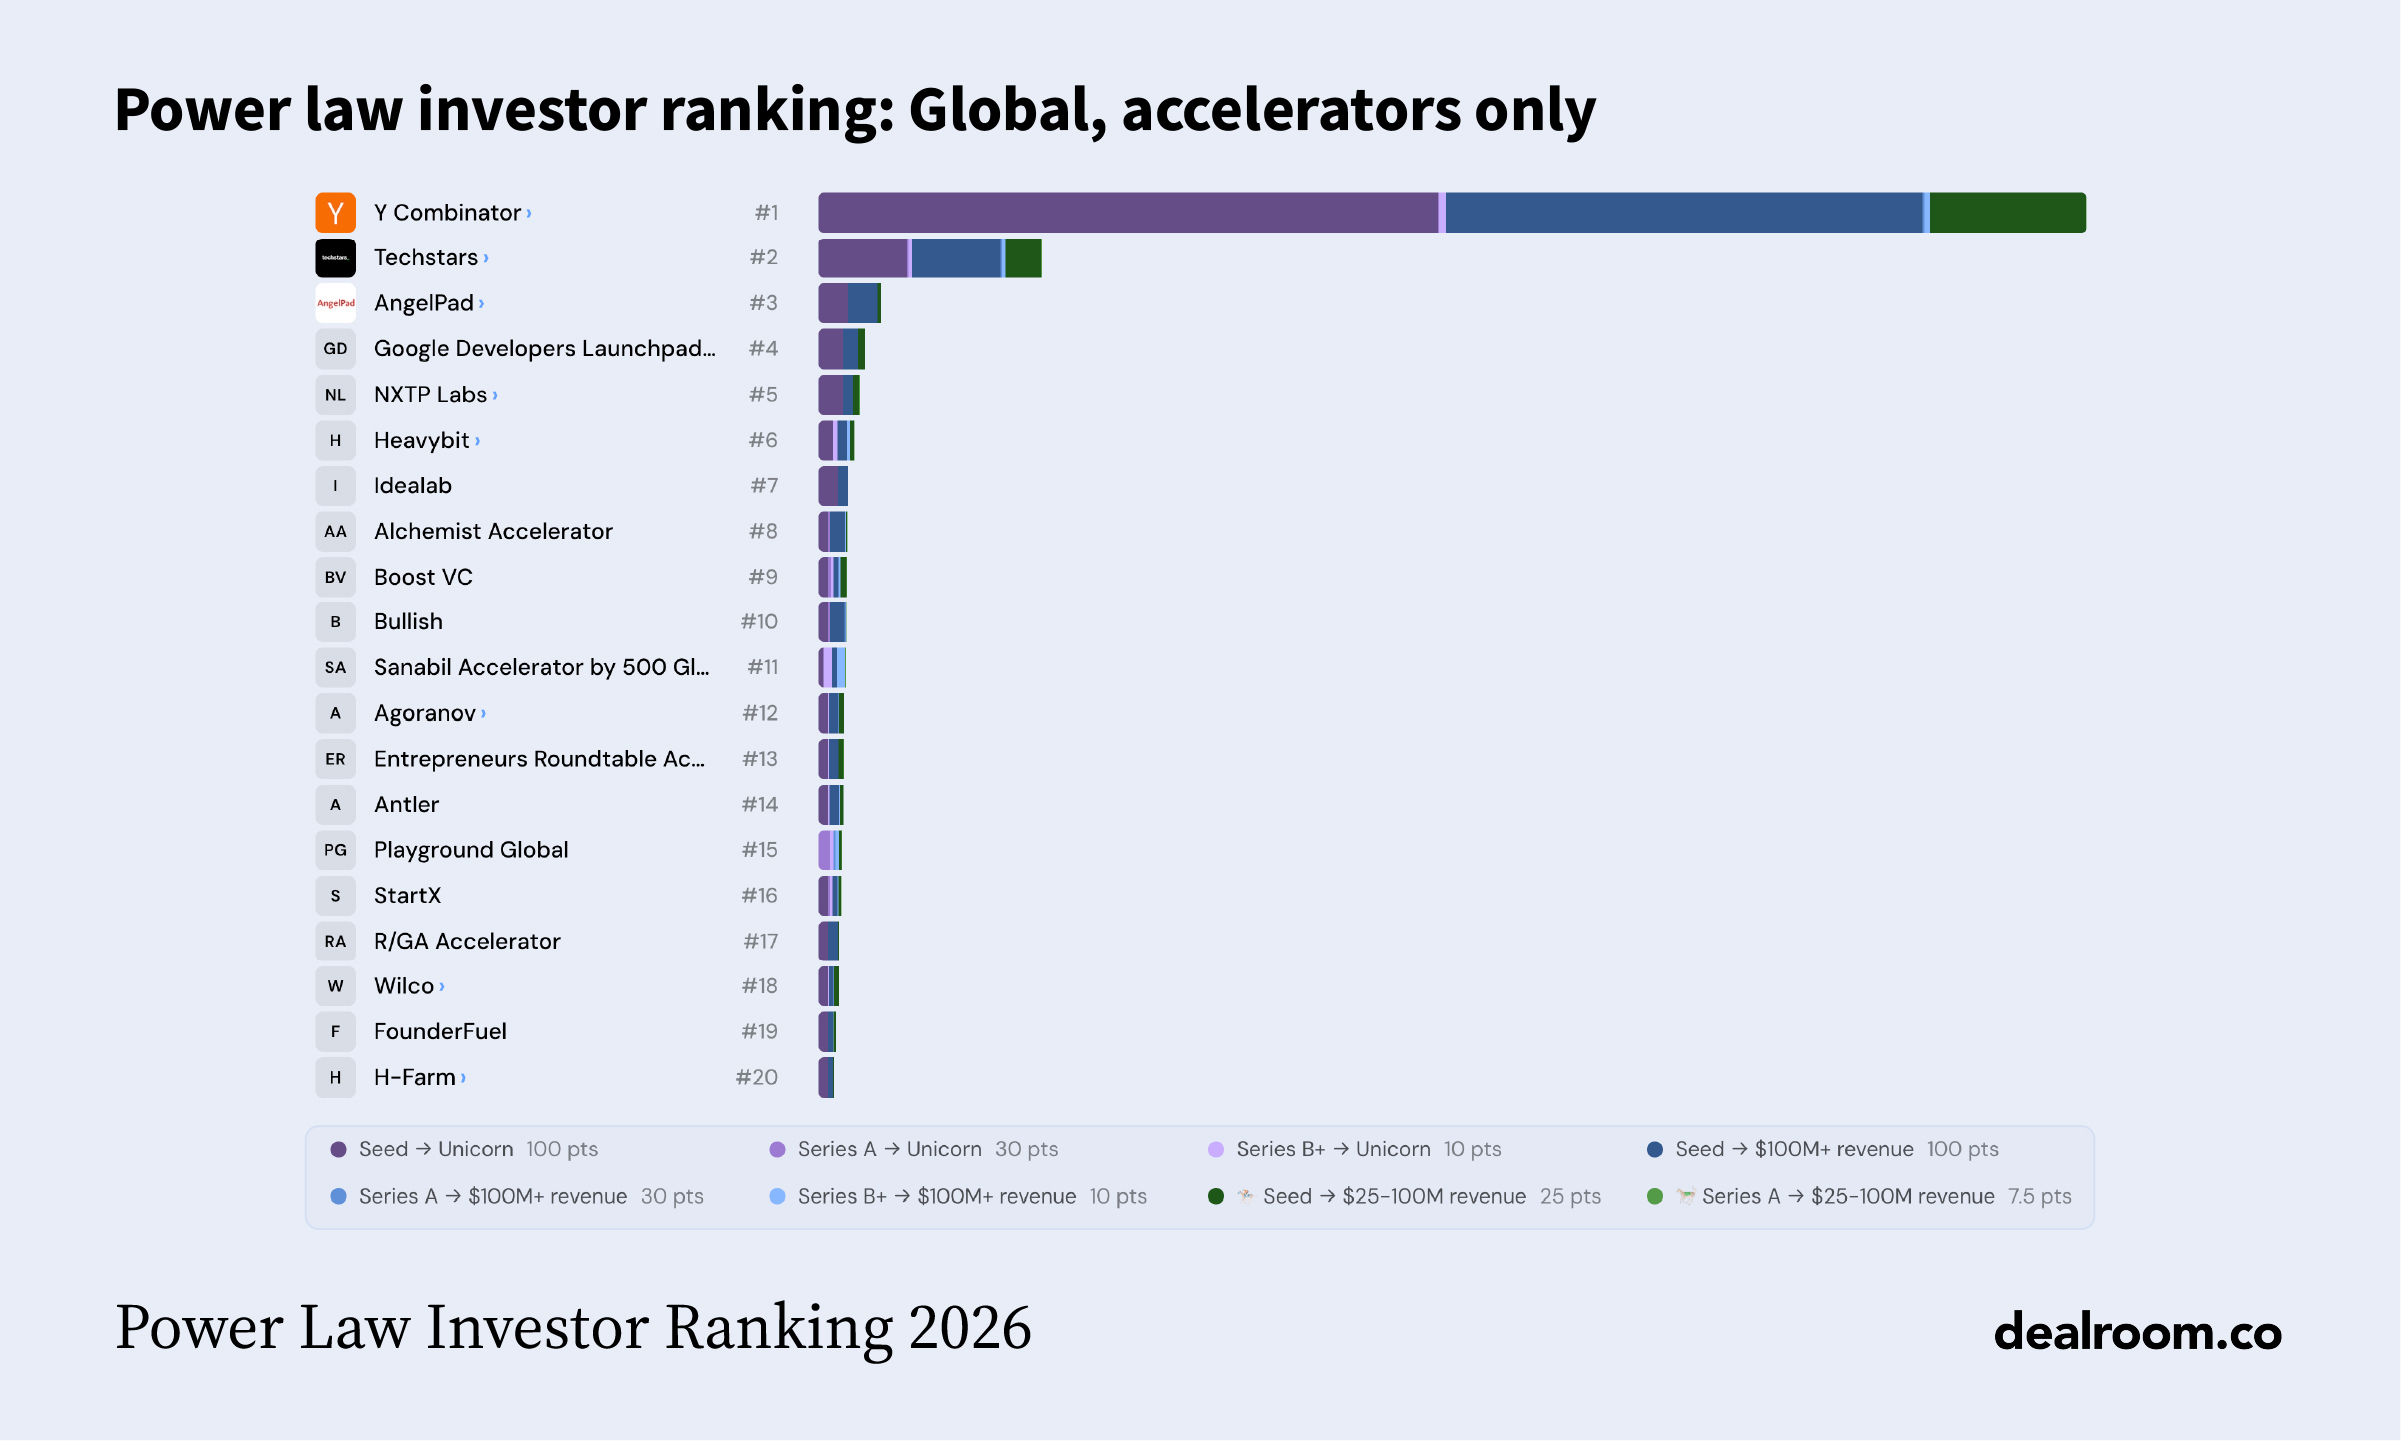
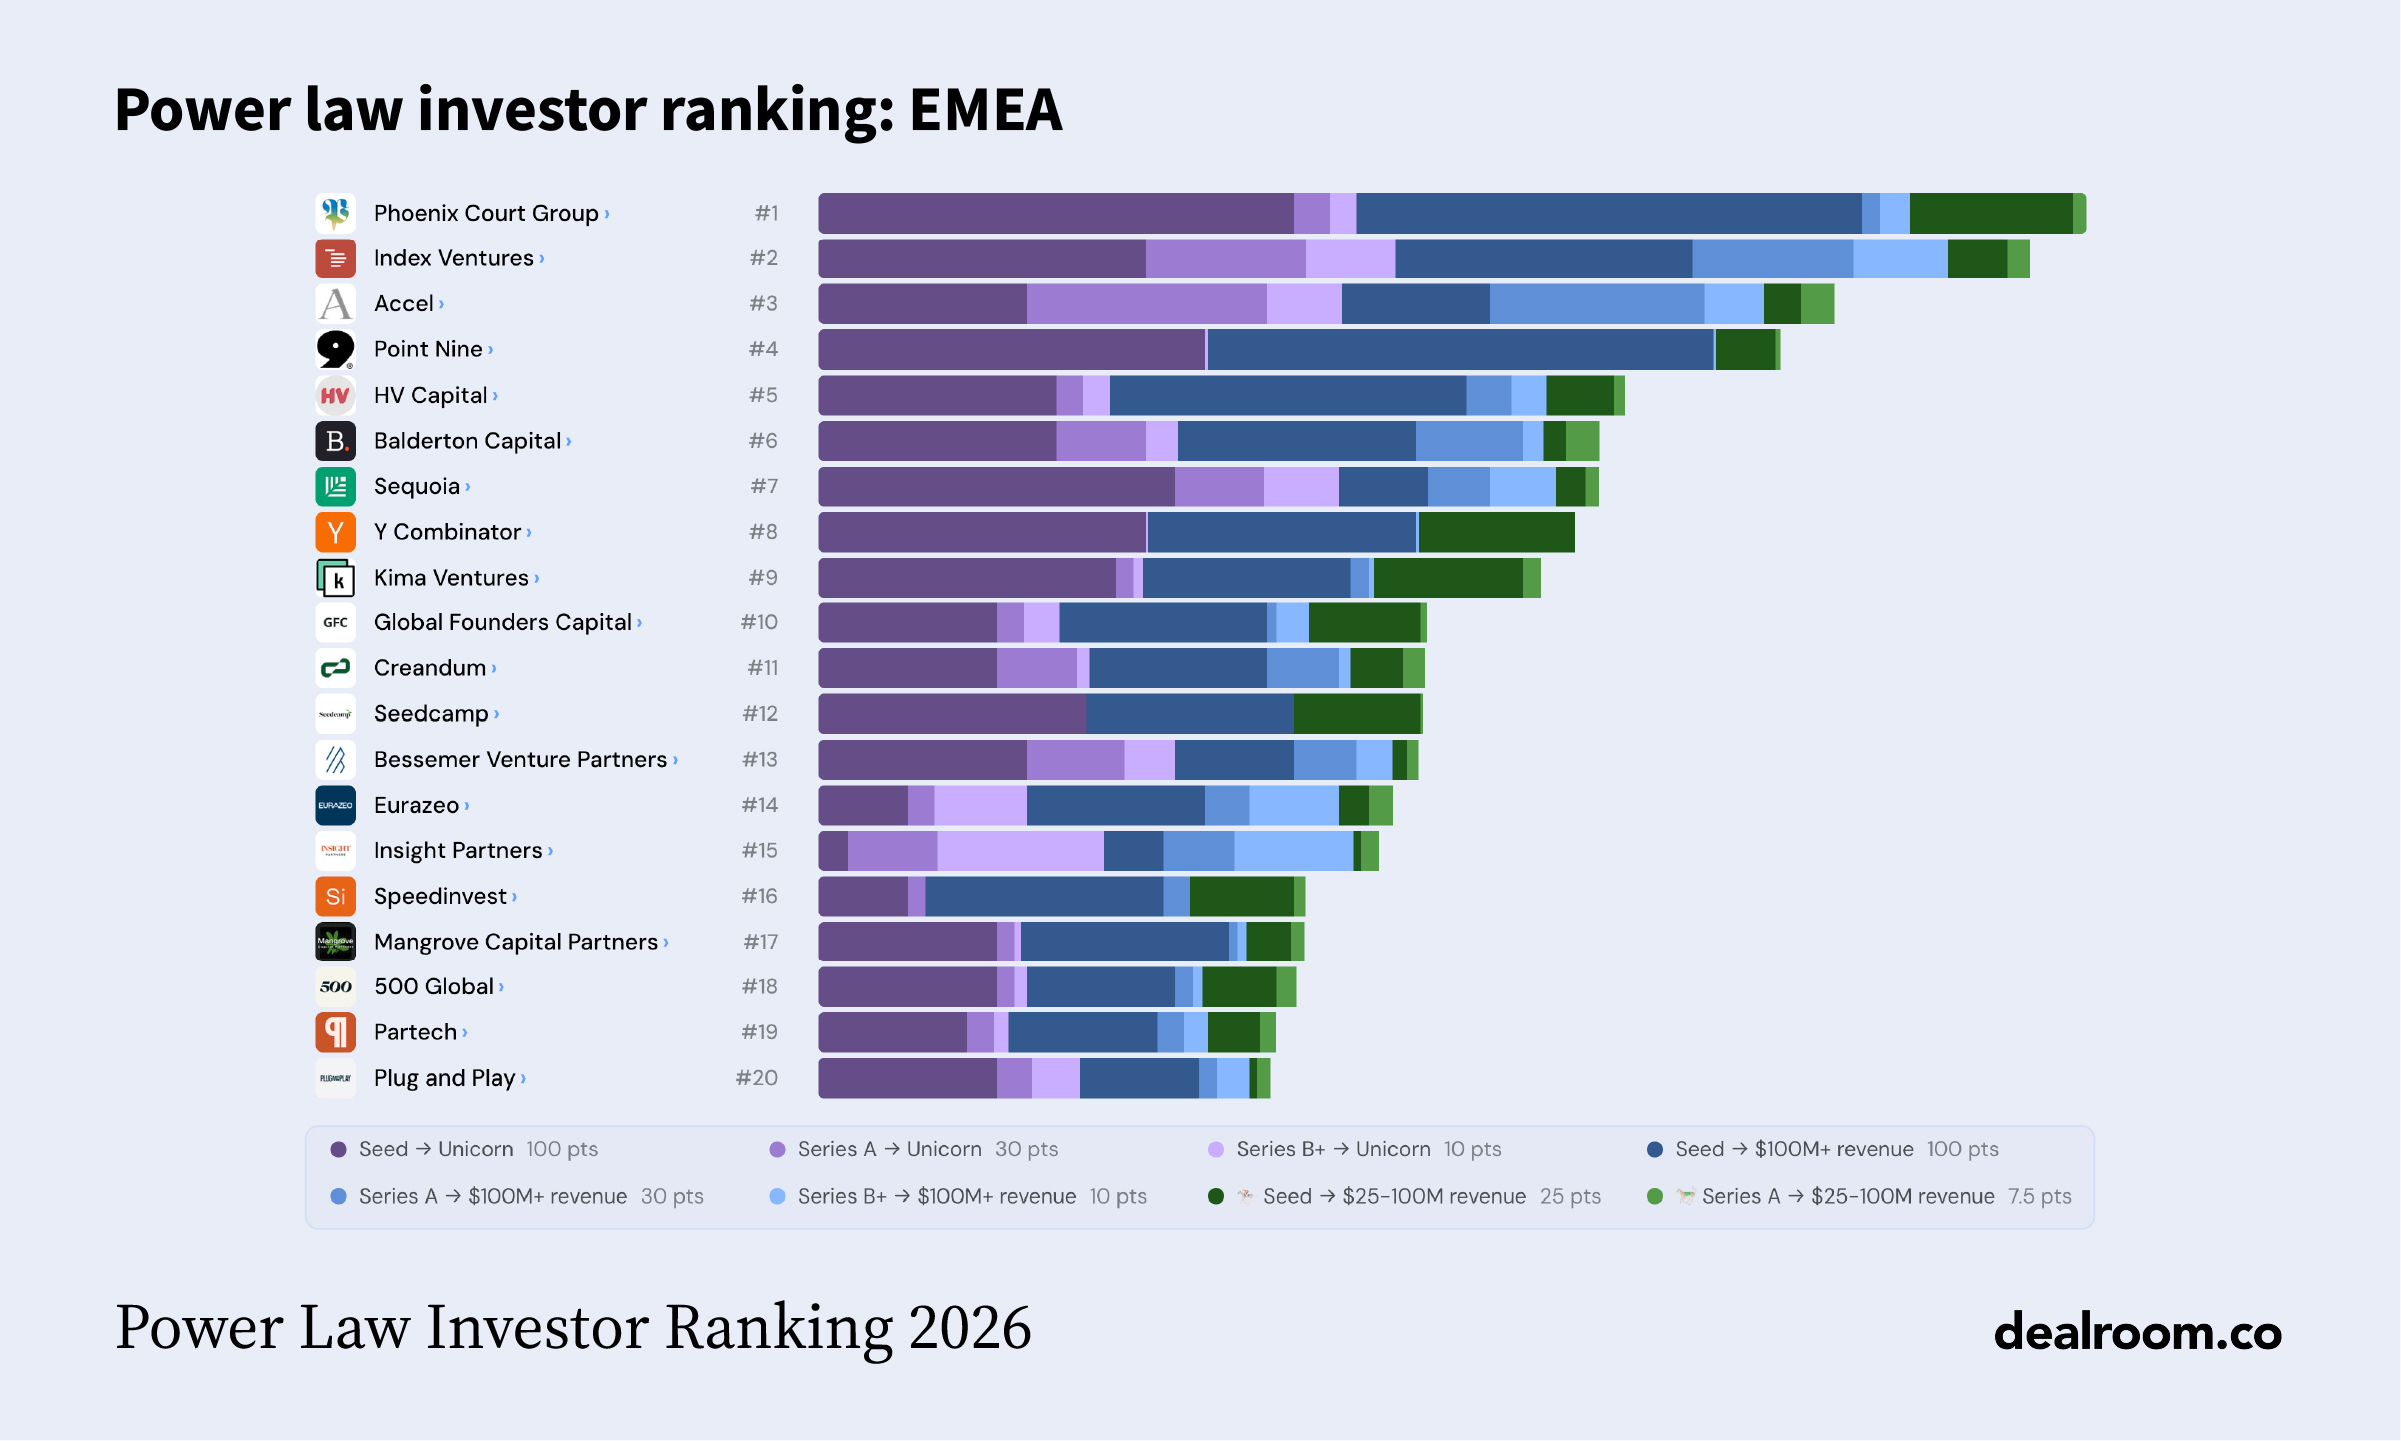
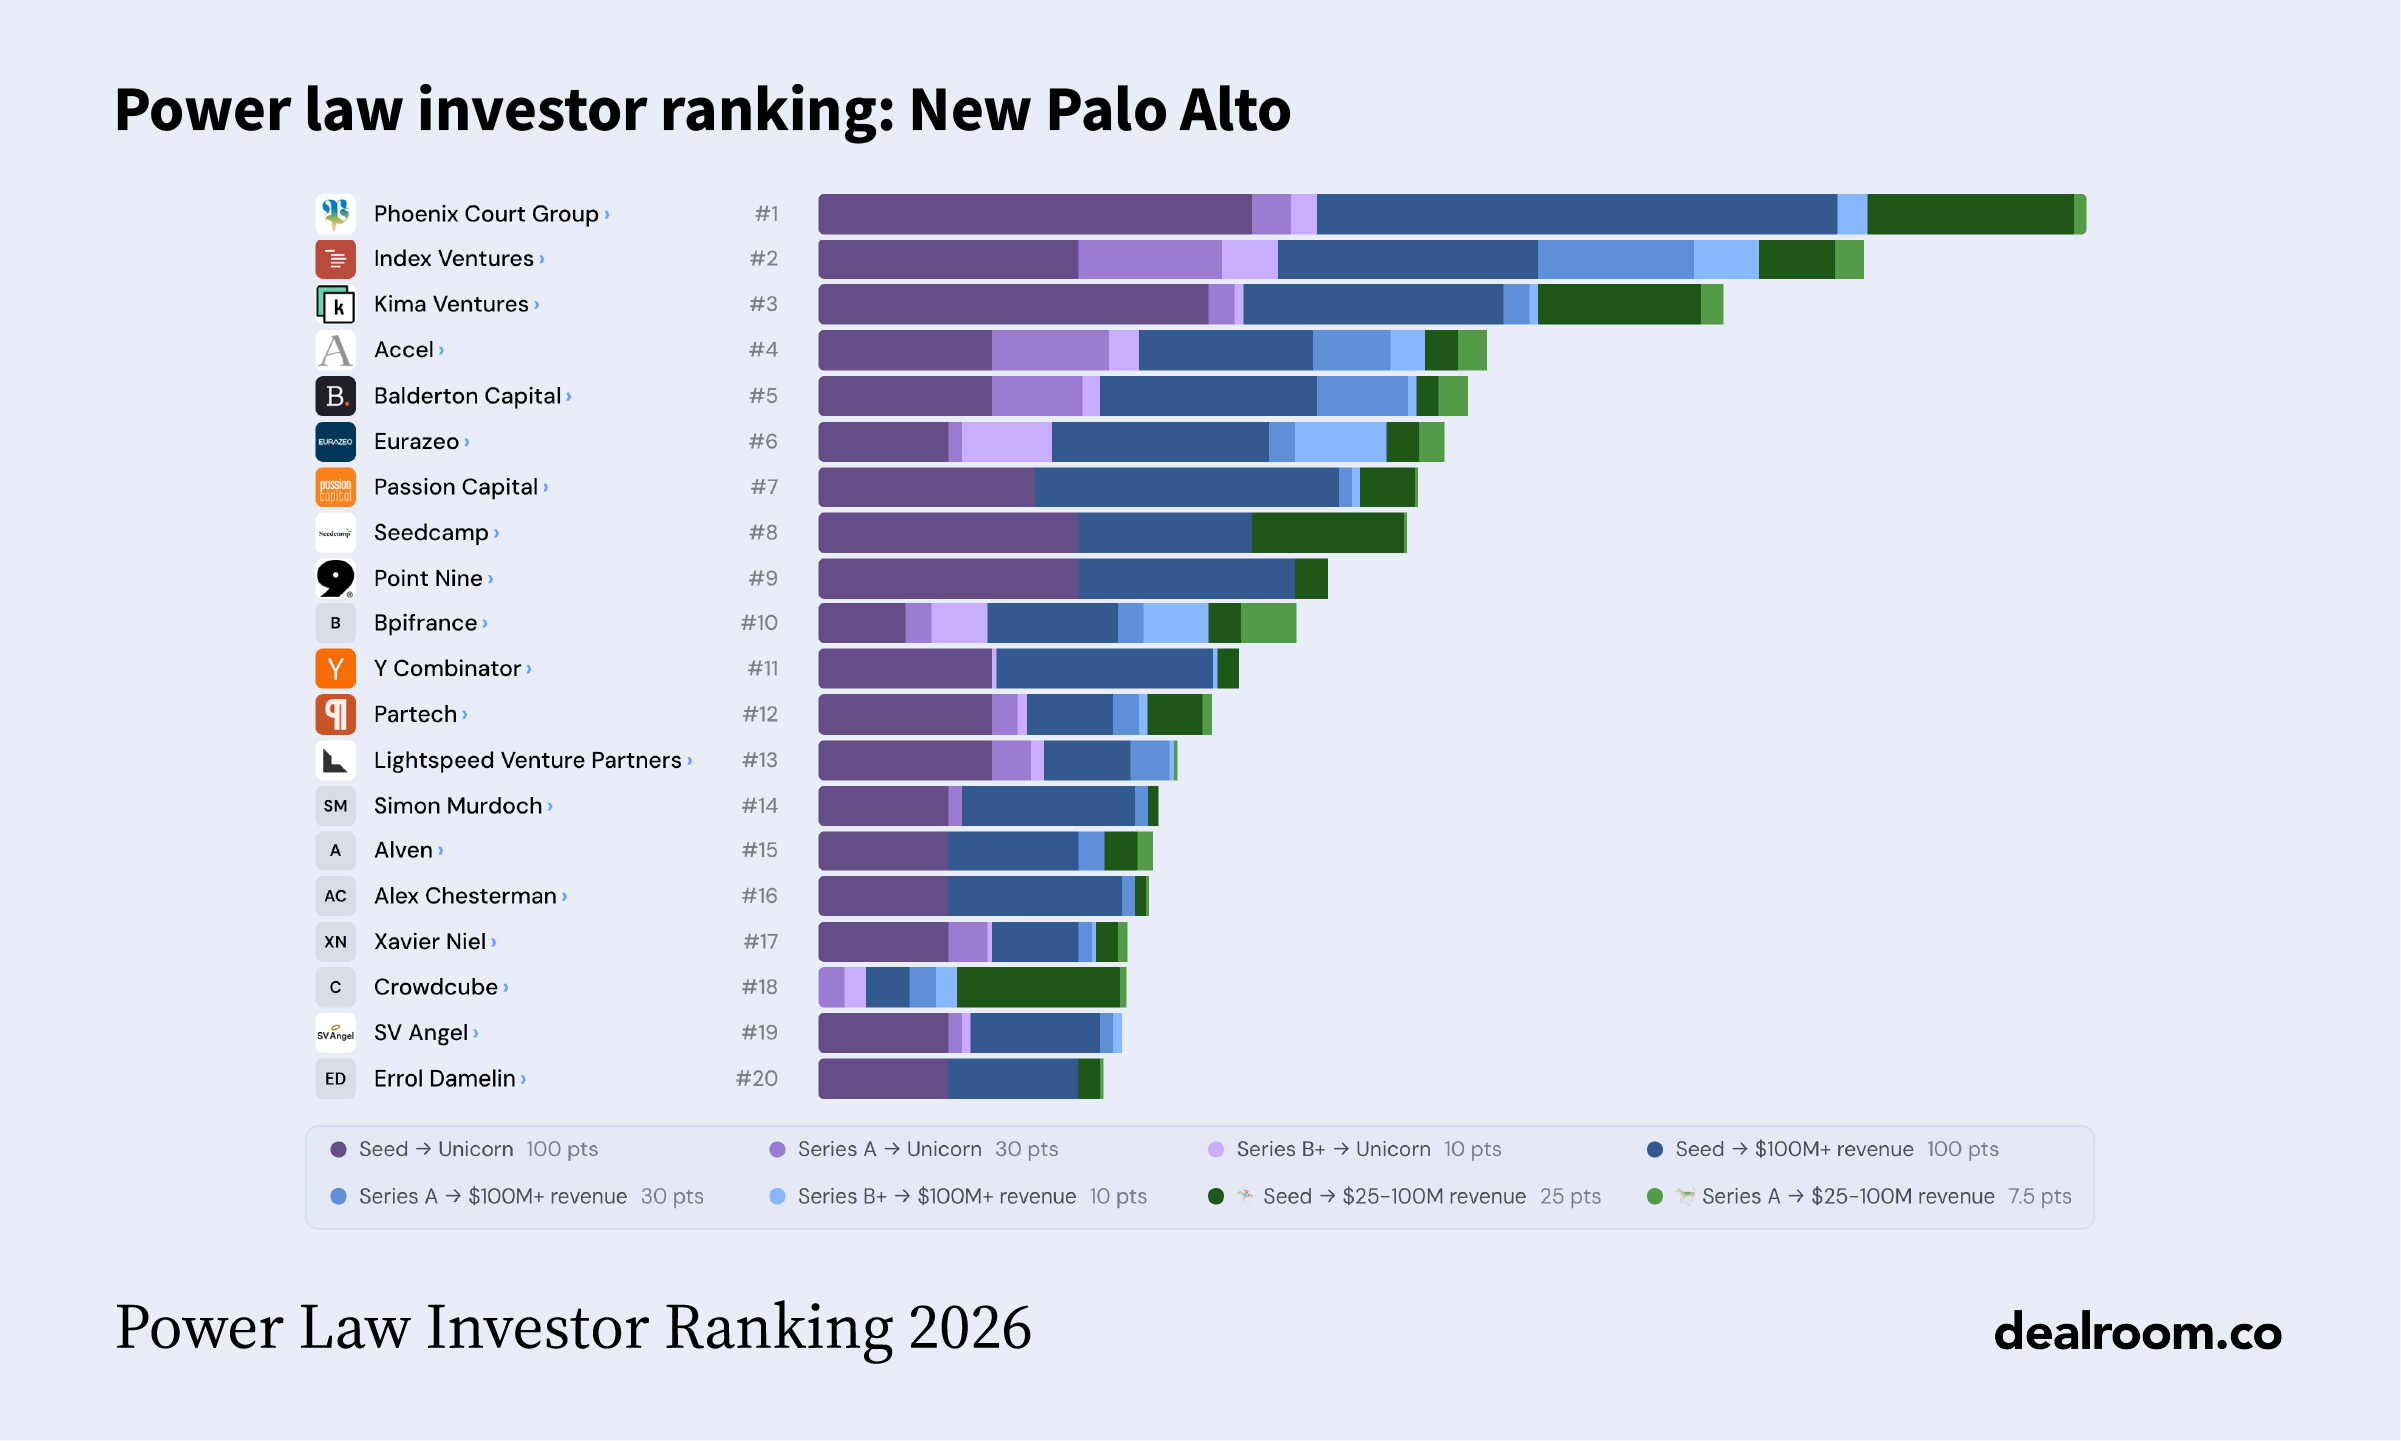
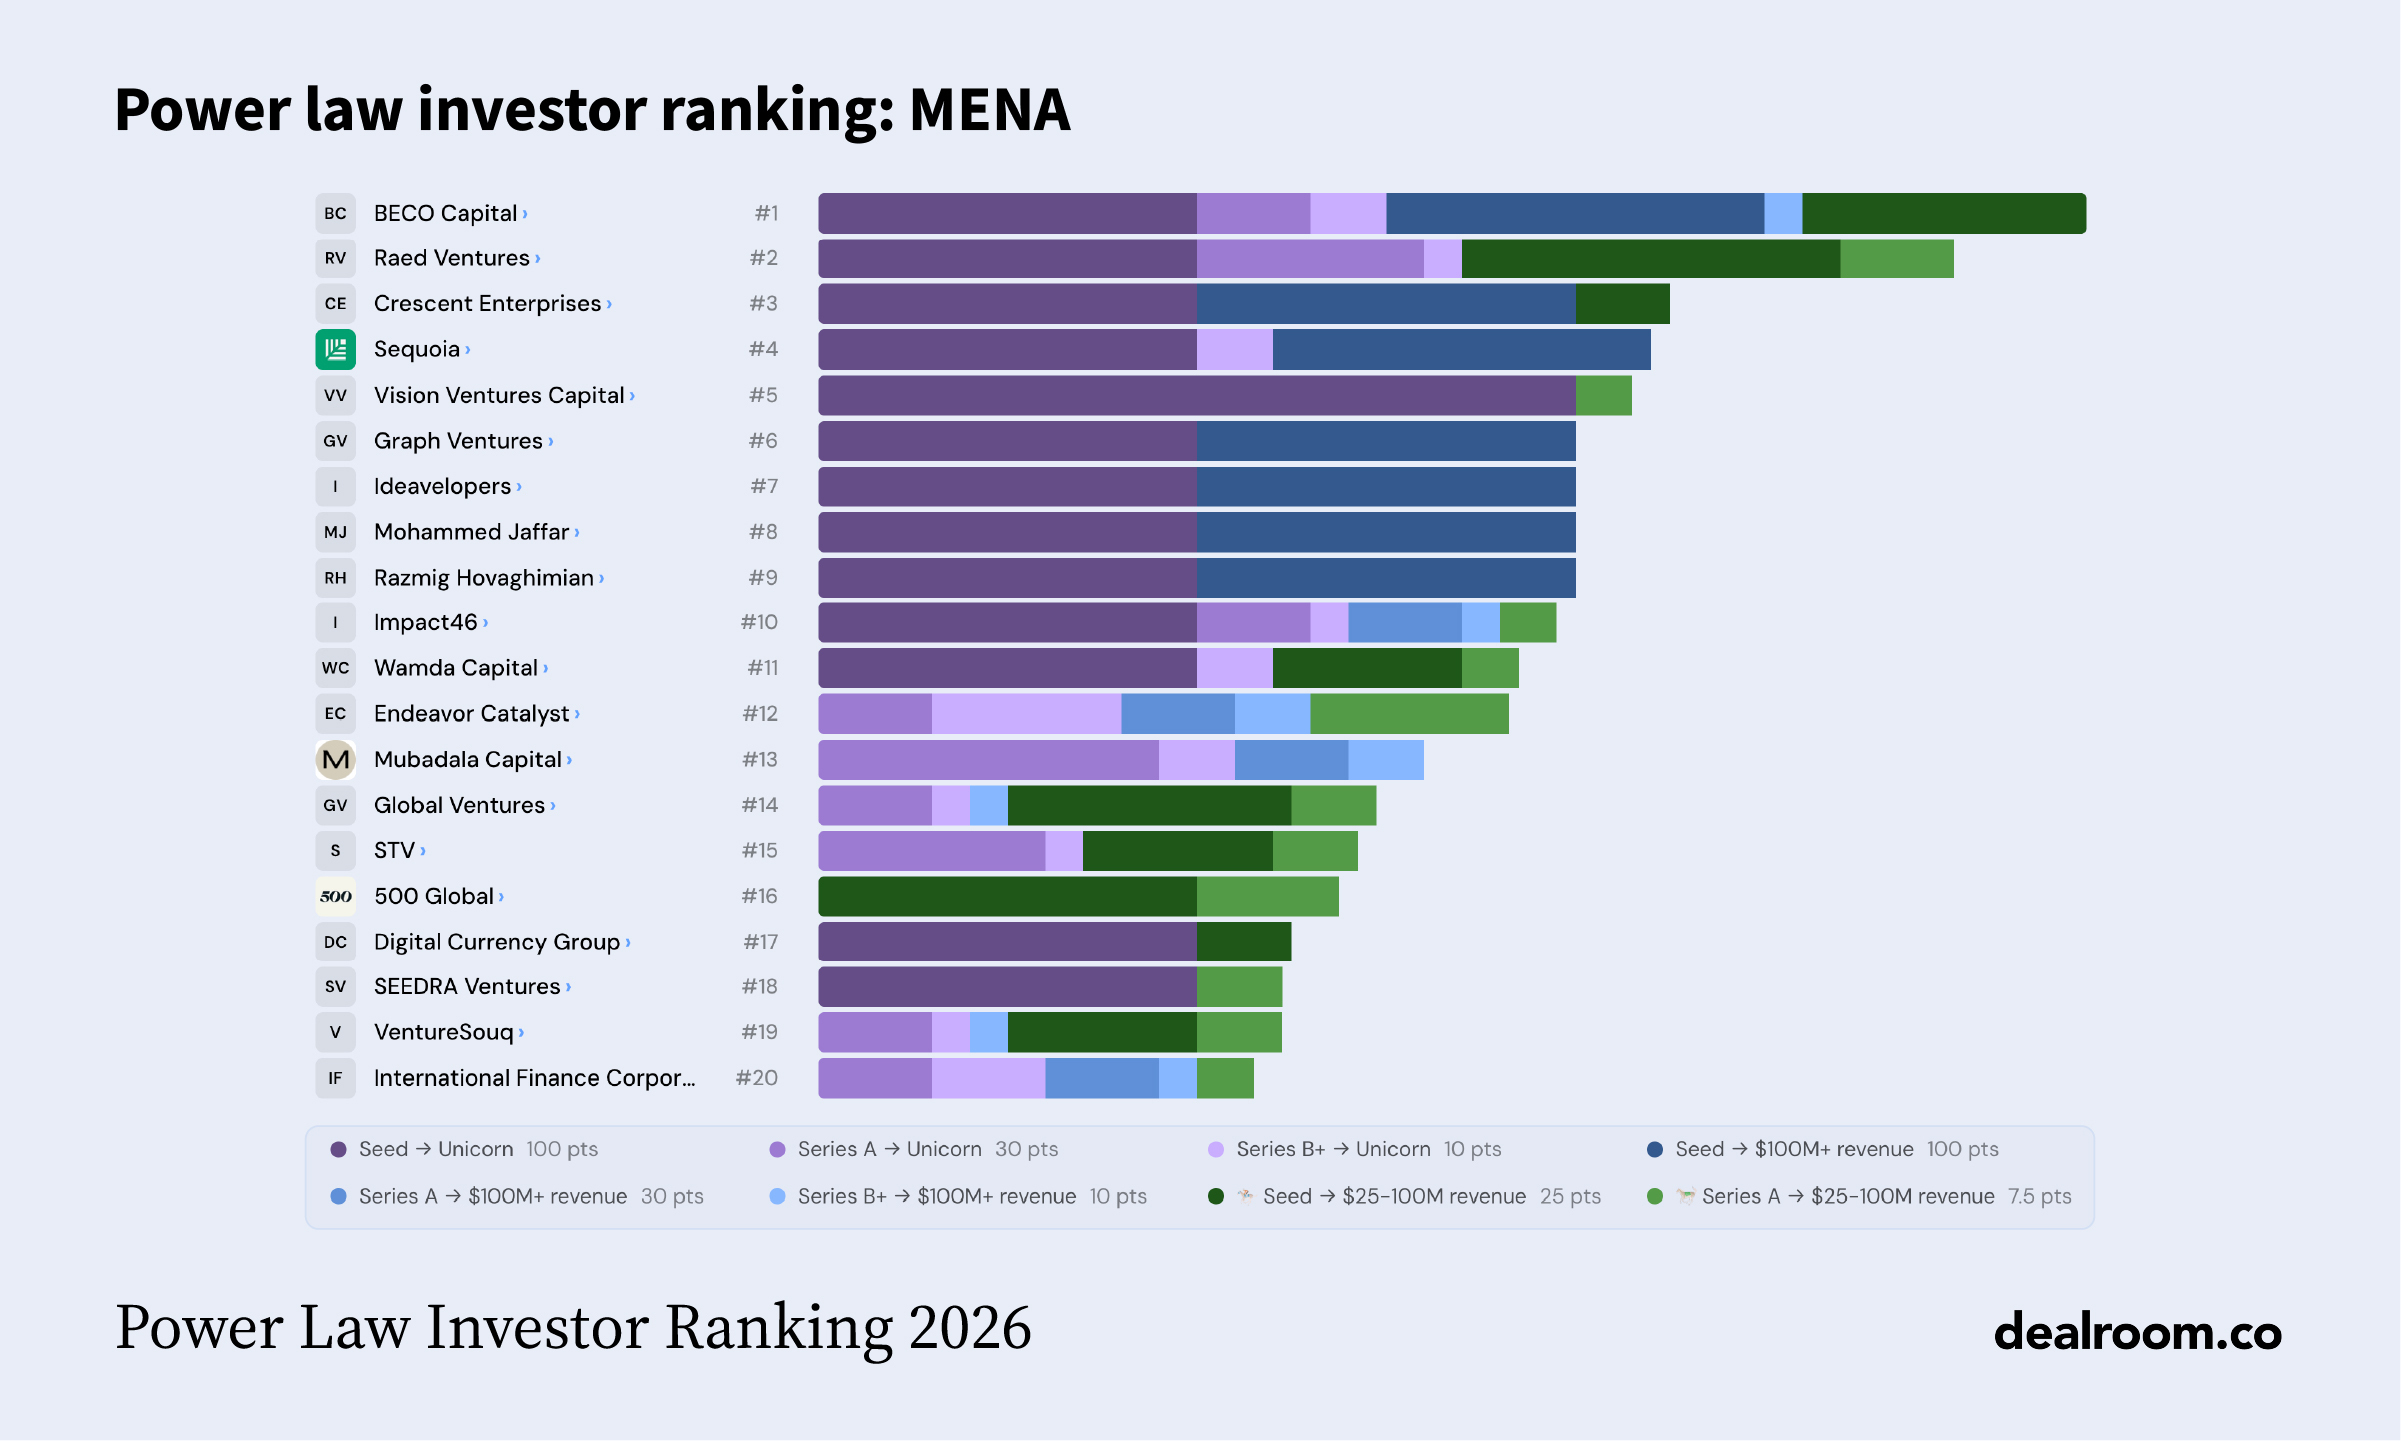
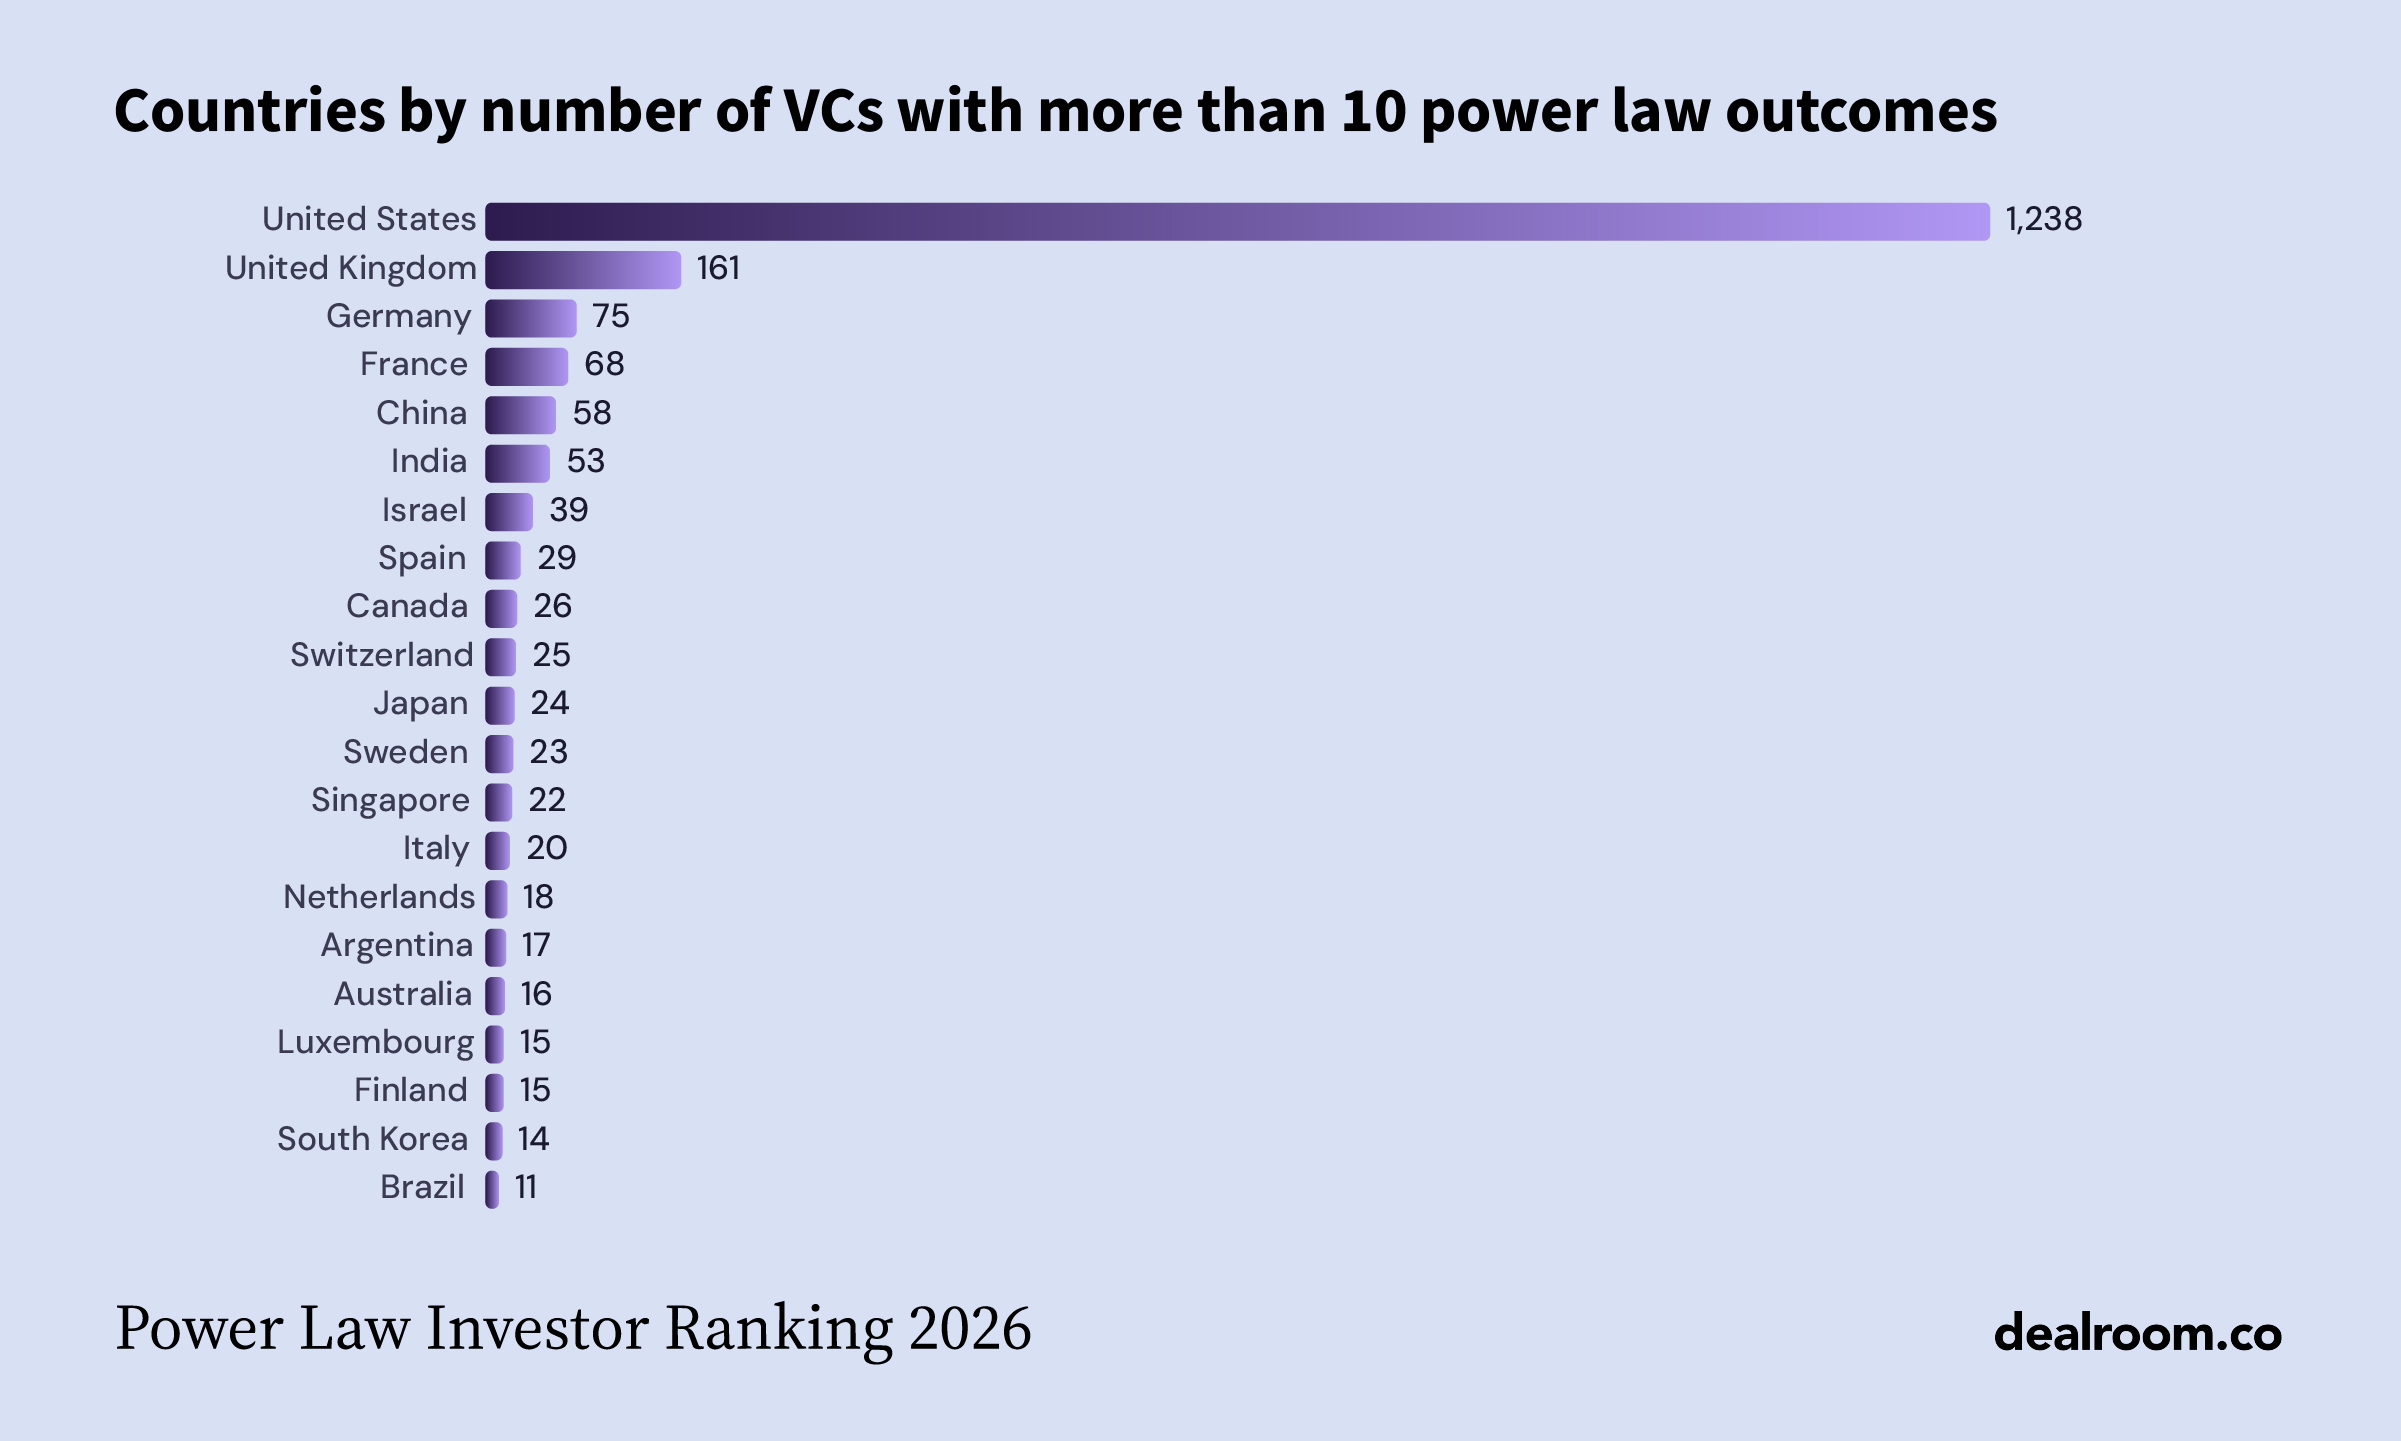
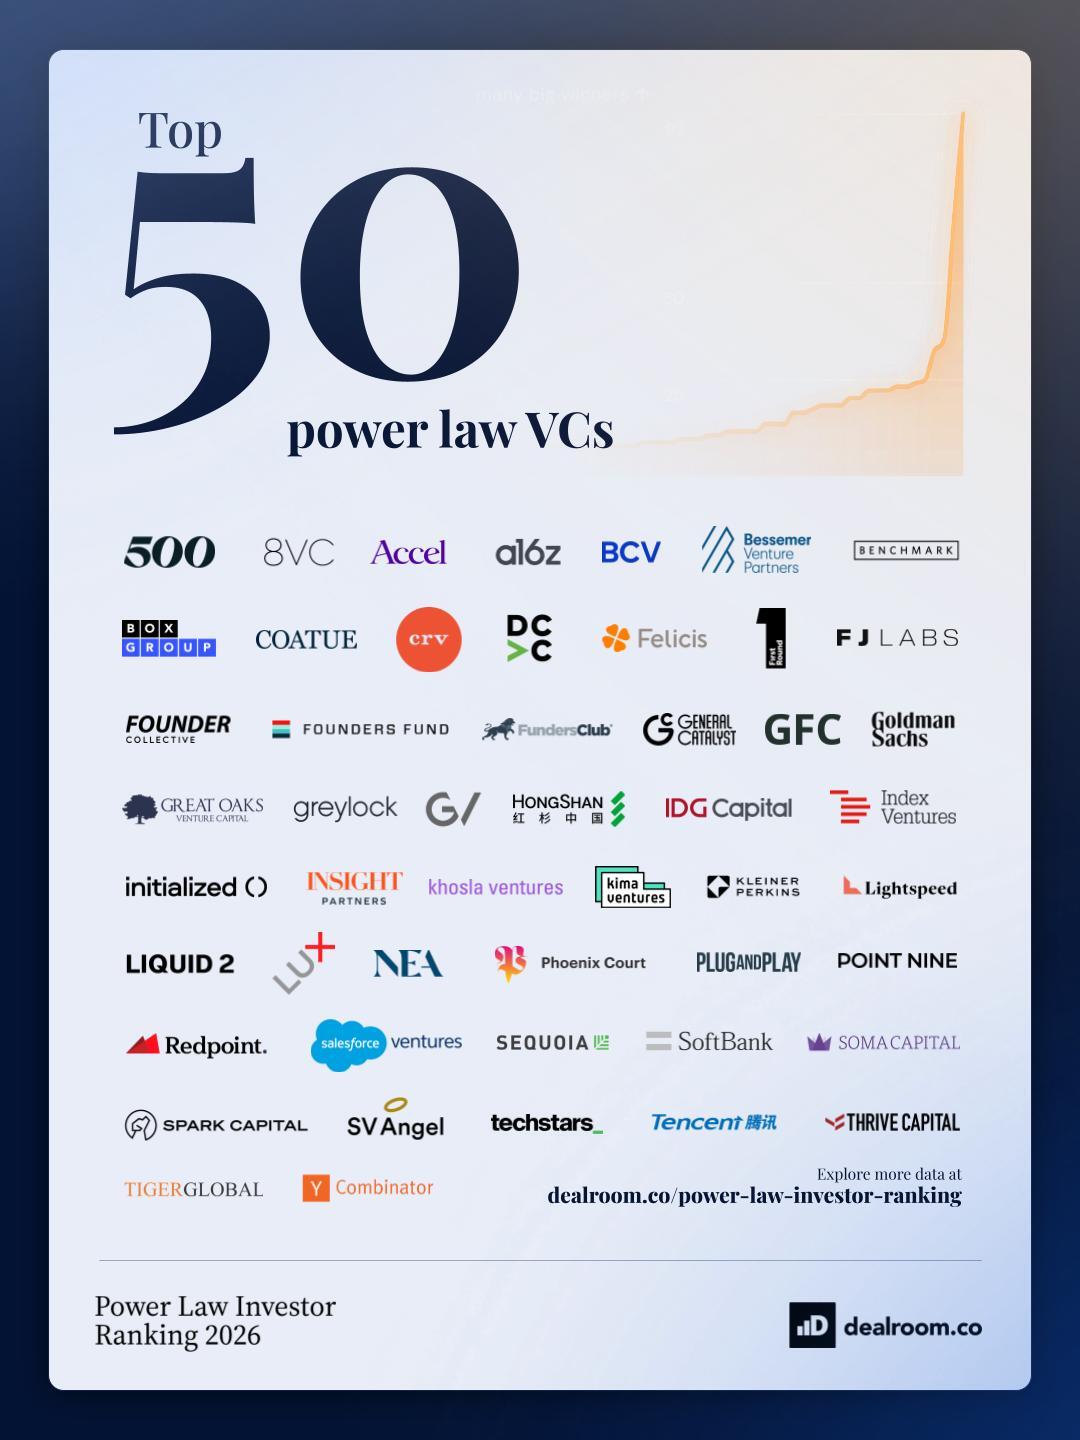
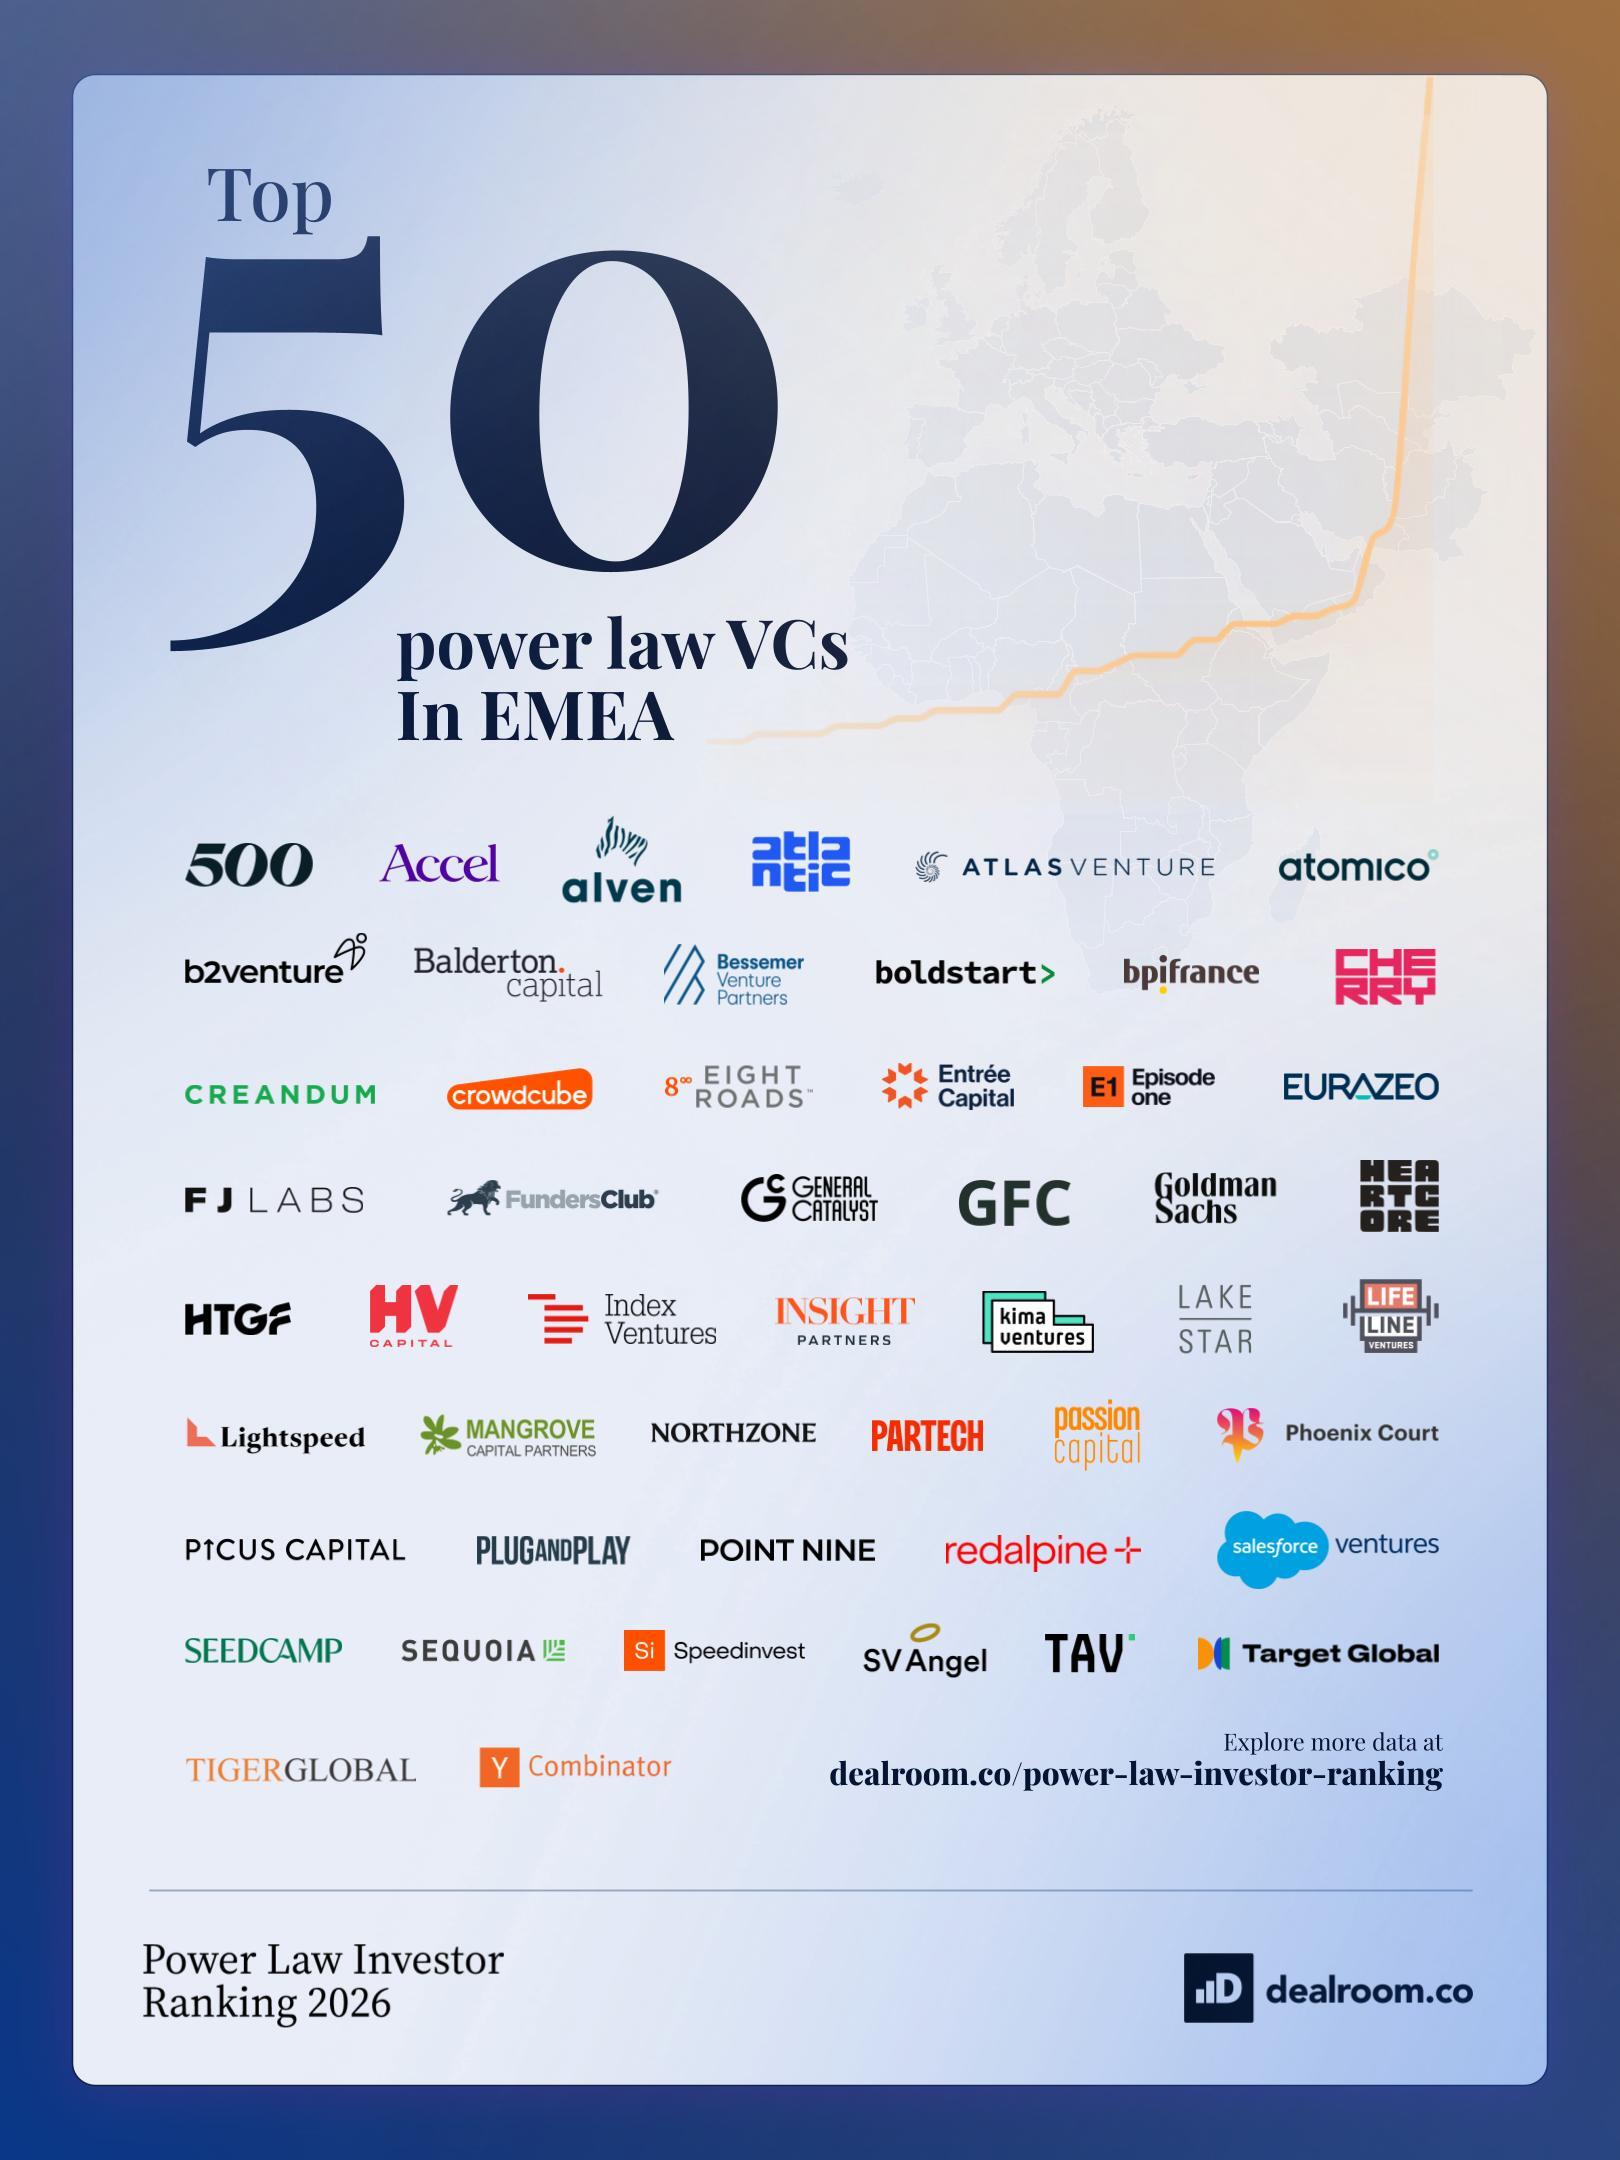
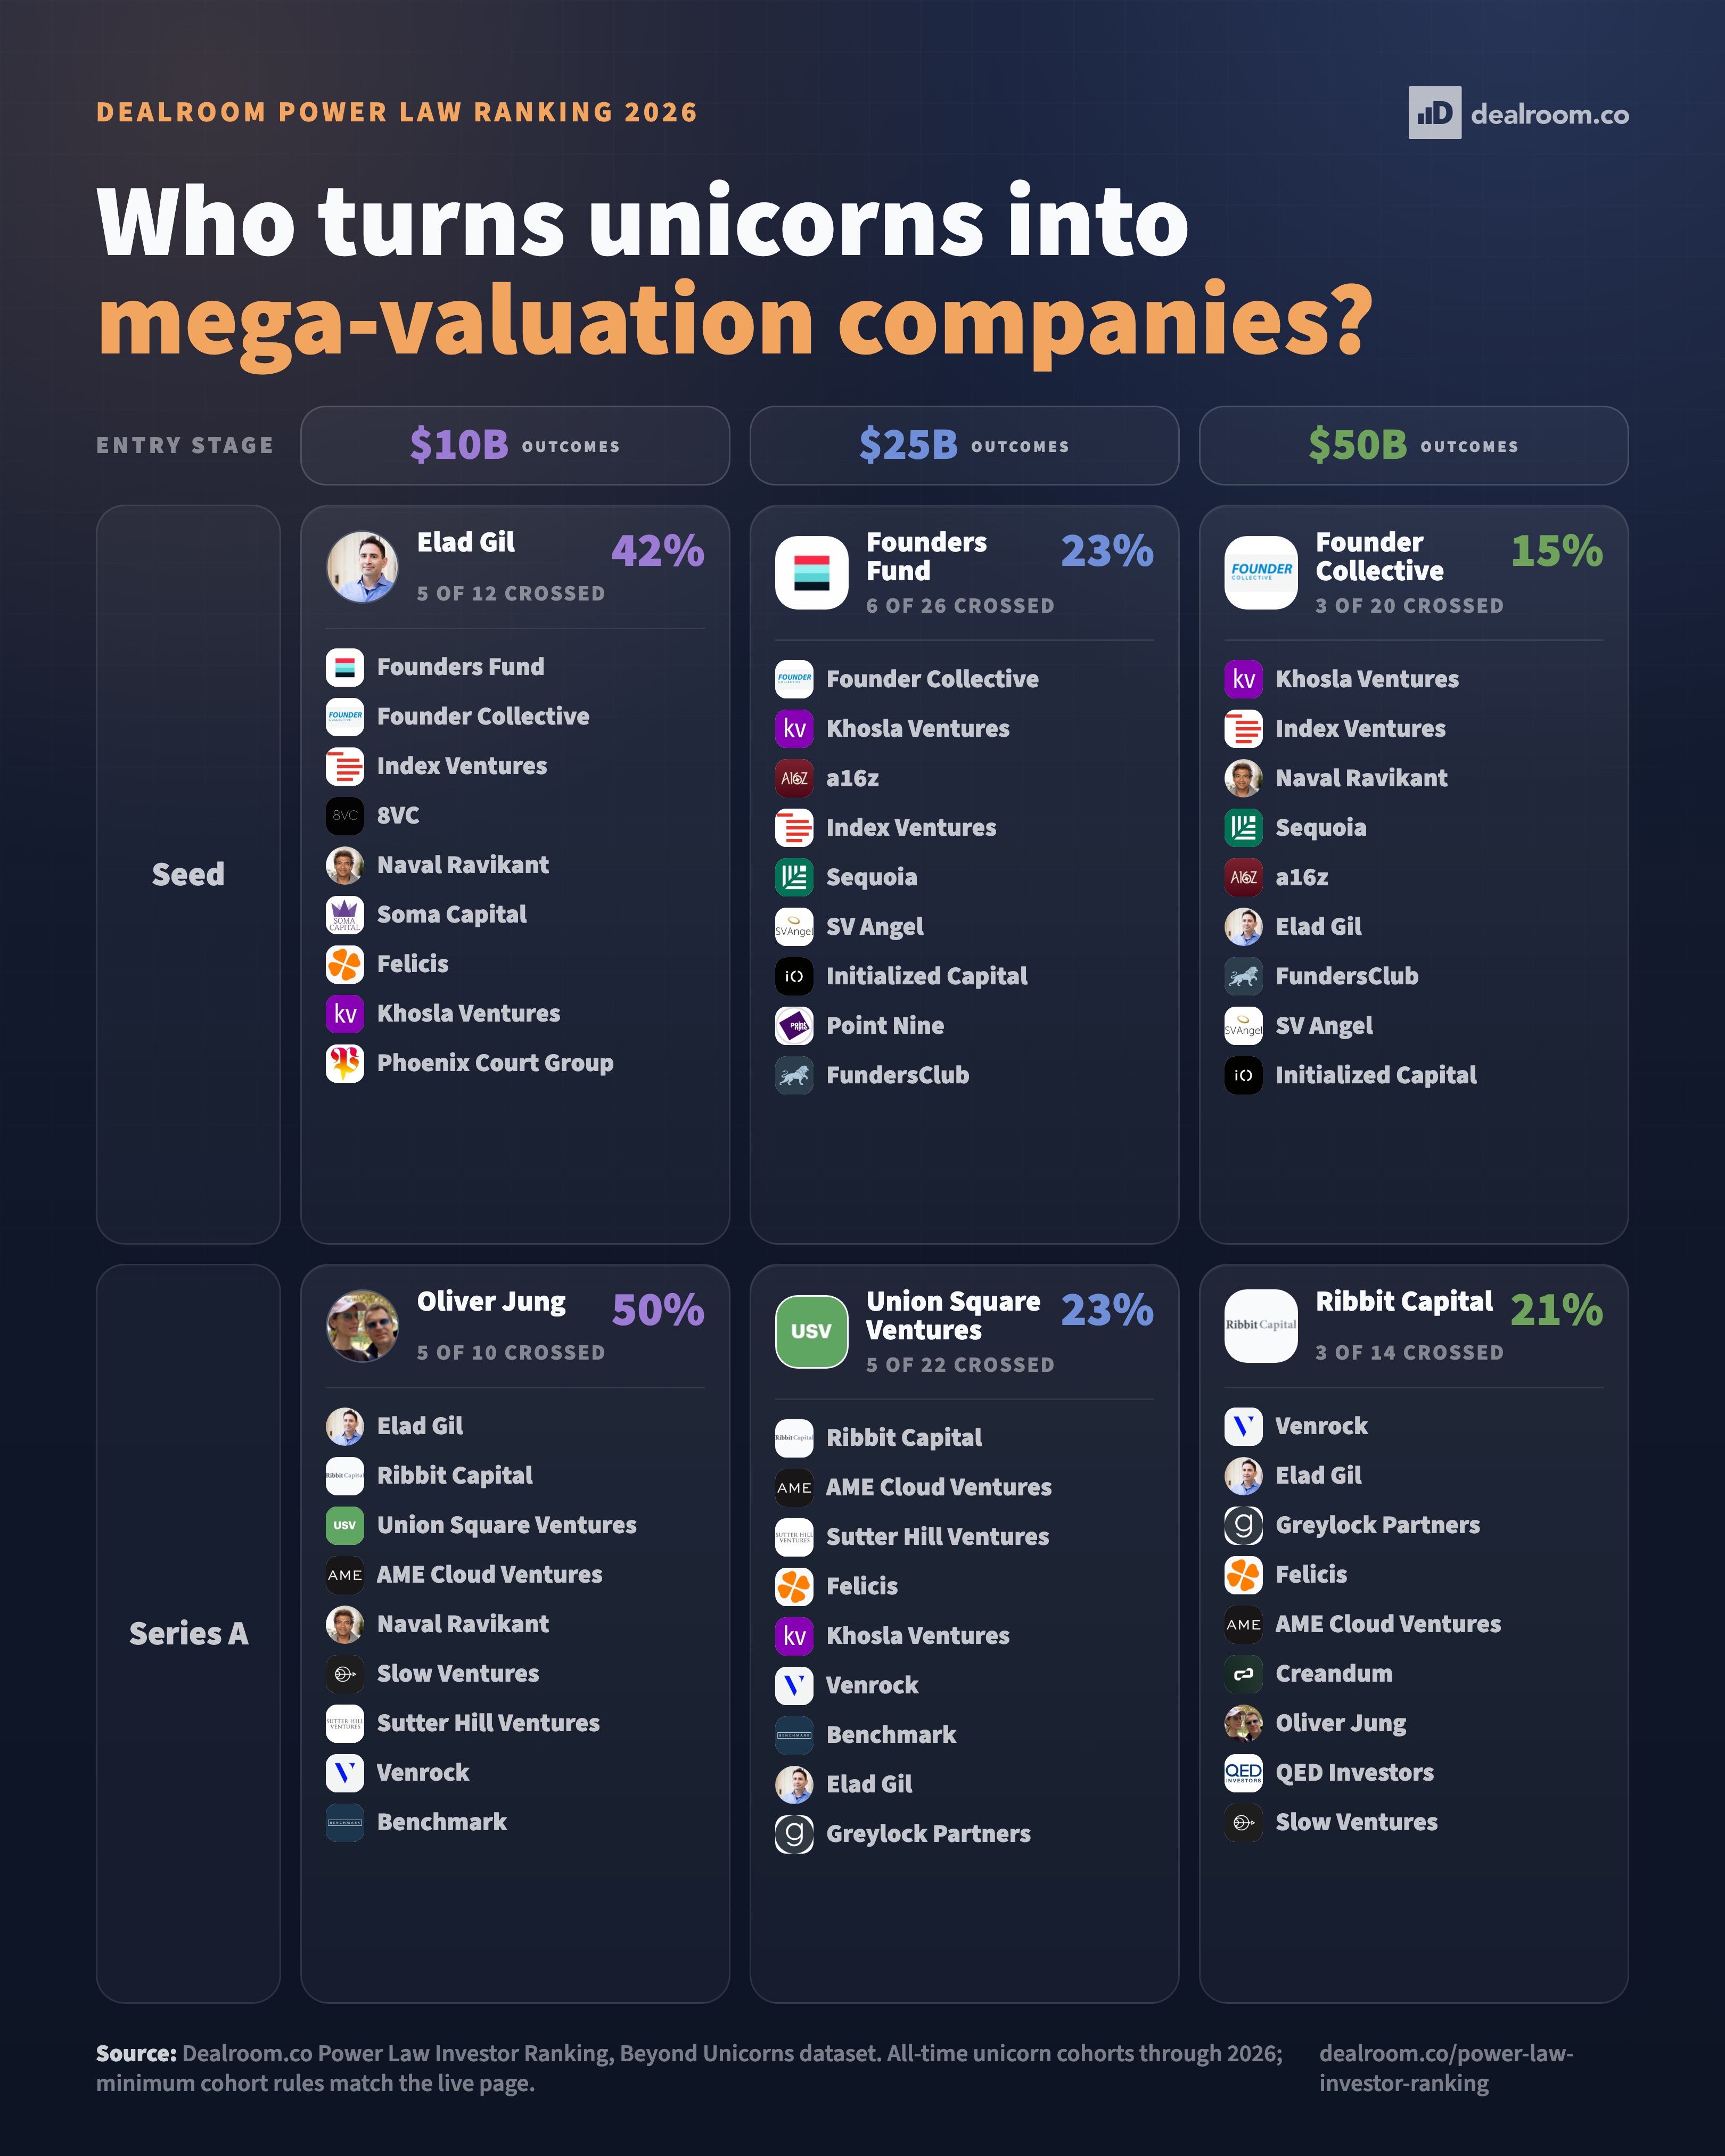
Rendered on demand from today's data — the freshest version of the ranking, formatted for sharing.
The 250 highest-scoring Power Law investors of 2026, sorted A→Z. 4:5 portrait for LinkedIn feeds.
The same 250 investors, ranked #1 → #250 by combined Power Law Score. 4:5 portrait for LinkedIn feeds.
Need a different format, custom cut, other questions? Email [email protected].
Book a demo with our team to see how Dealroom can help you make better investment decisions.
Book a Demo